
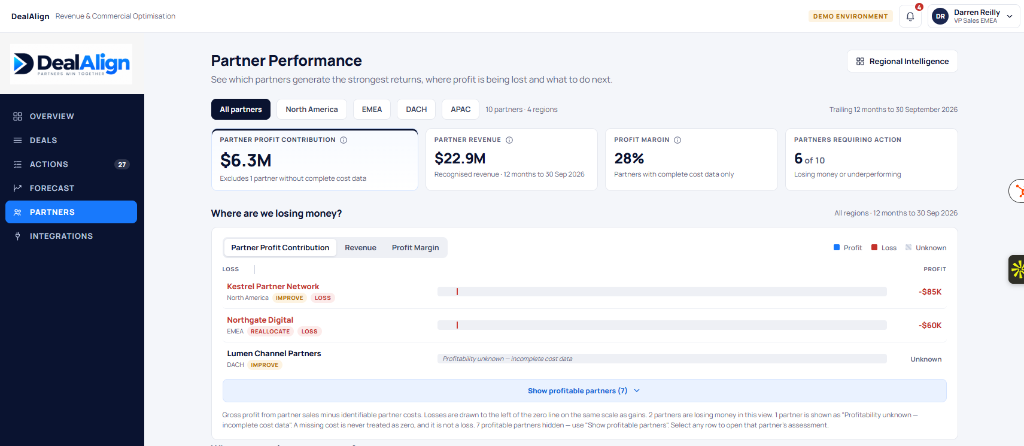
Partner profitability software calculates what each channel partner returns after every cost that partner causes — not just after cost of goods. For each partner you take partner-attributable gross profit and deduct that partner’s own commercial and operating costs: commissions, discounts and rebates, market development funds and joint marketing, presales and sales engineering, support and servicing, partner account management, and enablement. What remains is net partner contribution; divided by that partner’s revenue it gives contribution margin, which is the number that separates a large partner from a valuable one.
Who this is for, and why revenue reporting is not enough
This matters to the people accountable for partner-influenced revenue in organisations that sell through distributors, resellers, systems integrators and other third parties — across software, hardware, medical equipment and other partner-led sectors. In those businesses the partner is not a transaction; it is a relationship with its own cost base.
A pipeline report measures what was sold. It does not measure what it cost to sell that way, because cost is not a field in the opportunity record. So a partner that generates the largest revenue line can also be the one consuming most in commissions, discounts, presales and support — and nothing in a revenue report will show it.
DealAlign treats partner profitability as its own question, separate from sales revenue, and answers it on the same connected record as the deals and the actions underneath it.
How to calculate true profitability by partner
The calculation has two deductions, not one. Cost of goods comes off revenue to give gross profit; partner-specific commercial and operating costs then come off gross profit to give net contribution.
Net partner contribution = partner-attributable gross profit − partner-specific commercial and operating costs.
Contribution margin = net partner contribution ÷ partner-attributable revenue.
A worked example you can reproduce
Three fictional partners, with figures chosen so the arithmetic is checkable by hand. Every number below is illustrative demonstration data, not a customer result.
| Line | Northwind Distribution |
Meridian Reseller |
Halcyon Systems Integrator |
|---|---|---|---|
| Partner-attributable revenue | £2,000,000 | £900,000 | £3,200,000 |
| Cost of goods sold | £1,400,000 | £650,000 | £2,560,000 |
| Partner-attributable gross profit | £600,000 | £250,000 | £640,000 |
| Commissions, discounts and rebates | £120,000 | £54,000 | £192,000 |
| MDF and joint marketing | £30,000 | £18,000 | £64,000 |
| Presales and sales engineering | £45,000 | £60,000 | £150,000 |
| Support and servicing | £25,000 | £48,000 | £96,000 |
| Partner account management | £20,000 | £15,000 | £32,000 |
| Enablement and training | £10,000 | £12,000 | £24,000 |
| Total partner-specific costs | £250,000 | £207,000 | £558,000 |
| Net partner contribution | £350,000 | £43,000 | £82,000 |
| Contribution margin | 17.5% | 4.8% | 2.6% |
Check the arithmetic on the largest partner: £3,200,000 − £2,560,000 = £640,000 gross profit. Costs of £192,000 + £64,000 + £150,000 + £96,000 + £32,000 + £24,000 total £558,000. Therefore £640,000 − £558,000 = £82,000, and £82,000 ÷ £3,200,000 = 2.6%.
That is the finding the revenue report hides. Halcyon is the largest partner by revenue and the weakest by margin. Northwind generates £1.2m less revenue but more than four times the absolute contribution. A leader looking only at revenue would invest in the wrong relationship.
What costs should be attributed to a distributor or reseller
DealAlign works from two cost groups, and both come off gross profit rather than revenue, so nothing already inside cost of goods is deducted a second time.
- Commercial costs — commissions, discounts and rebates, market development funds and joint marketing.
- Operating costs — presales and sales engineering, support and servicing, partner account management, training and enablement, and other costs incurred specifically in serving that partner.
The rule is attribution, not allocation by revenue share. A cost is counted once, at the partner it relates to. Where a cost genuinely serves several partners, it is allocated on a stated basis rather than divided arbitrarily, and the basis is visible so the figure can be challenged.
How commissions, rebates, MDF, presales and support change contribution
These costs do not move together, and that is the point. In the example above, Halcyon’s commissions are a normal proportion of its revenue; what removes its margin is the operating cost around it — £150,000 of presales and £96,000 of support. Meridian is the reverse: modest commercial cost, but presales heavier than its commission bill. A single blended “cost to serve” percentage would average both problems away and recommend the same action to each partner.
Separating the two cost groups is what makes the recommendation differ: one partner needs a commercial conversation, the other needs a delivery and support conversation.
How to identify financially weak or unprofitable partners
Two failure modes look identical in a revenue report and completely different once cost is attributed:
- Insufficient revenue — the margin rate is healthy but the absolute contribution is too small to justify the cost of the relationship.
- Excessive operating cost — the revenue is substantial but the margin is thin or negative because serving that partner consumes more than it returns.
Read together, contribution and margin separate them. A partner with a healthy margin and little demand needs a demand-generation decision. A partner with strong revenue and a thin margin needs a cost decision. DealAlign reports a negative contribution as negative rather than rounding it to breakeven.
Deciding where to invest, improve or reallocate
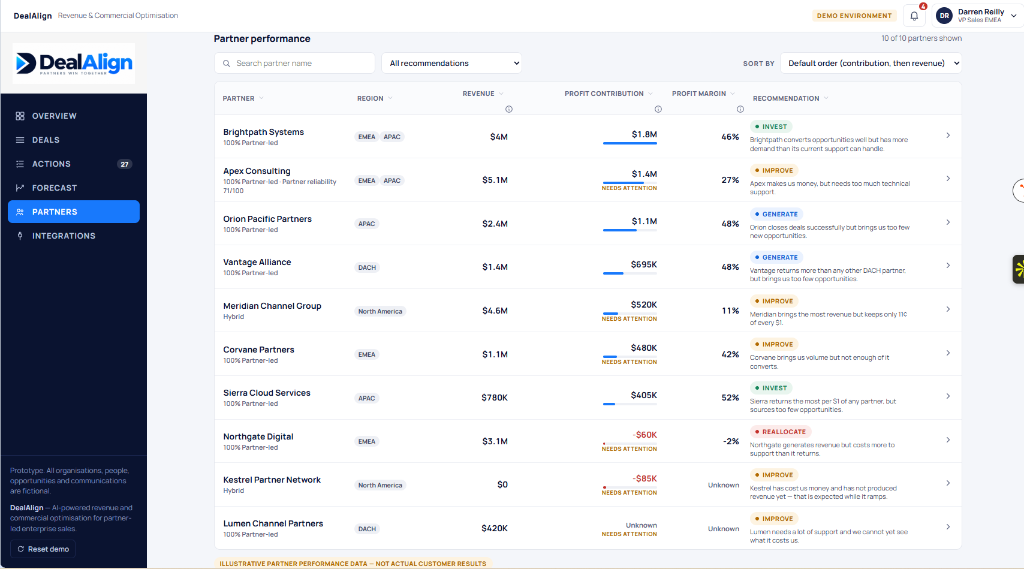
For each partner the product proposes one of four actions — invest, improve, generate or reallocate or exit — with the problem, the supporting evidence, the proposed action and the expected commercial benefit stated alongside it. The recommendation is there to be argued with; the point is that the reasoning is visible rather than implied.
Actual versus estimated costs, and what happens when data is missing
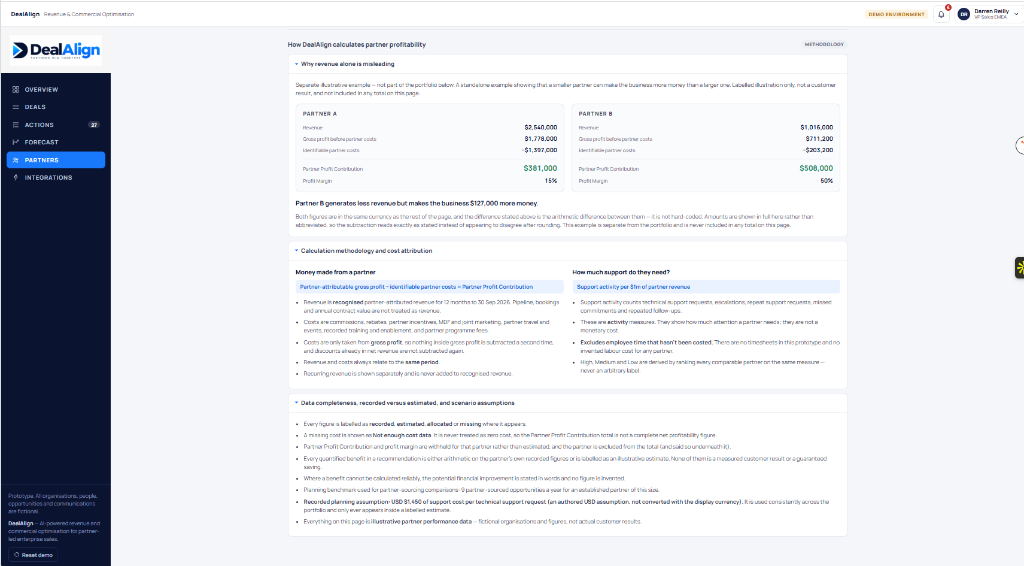
Cost data is rarely complete, and pretending otherwise is how a profitability model loses credibility. DealAlign separates three states and never merges them:
- Recorded — a cost that exists in a system and can be traced to the partner.
- Estimated — a cost attributed on a stated basis because no direct record exists.
- Unknown — a cost with no basis at all. A missing cost is reported as unknown, never as zero.
A partner whose cost data is too incomplete to judge is shown as unassessed rather than being presented as profitable or as a loss. That is a deliberate brake: an unassessed partner is a data question, not a commercial verdict.
What information you provide to DealAlign
Profitability analysis is only as good as the inputs, so the input list is stated plainly. For each partner:
- Revenue attributable to that partner, and cost of goods or a standard cost basis.
- Commercial costs — commissions, discounts and rebates, MDF and joint marketing.
- Operating costs — presales and sales engineering time, support and servicing, partner account management, enablement.
- A completeness statement per cost line — whether the figure is recorded, an estimate and on what basis, or unknown.
Today the product works from recorded demonstration data rather than from a live connection to a customer’s finance or CRM system. There is no live Salesforce, HubSpot or finance-system integration. How data gets in, and what is planned rather than built, is set out on the product page.
What DealAlign demonstrates today
The MVP is ready for a guided demonstration. On the profitability side it shows, using fictional data: net partner contribution and contribution margin for every partner; the effect of each cost group on that margin; a per-partner recommendation of invest, improve, generate or reallocate; and transparent handling of recorded, estimated and missing cost data.
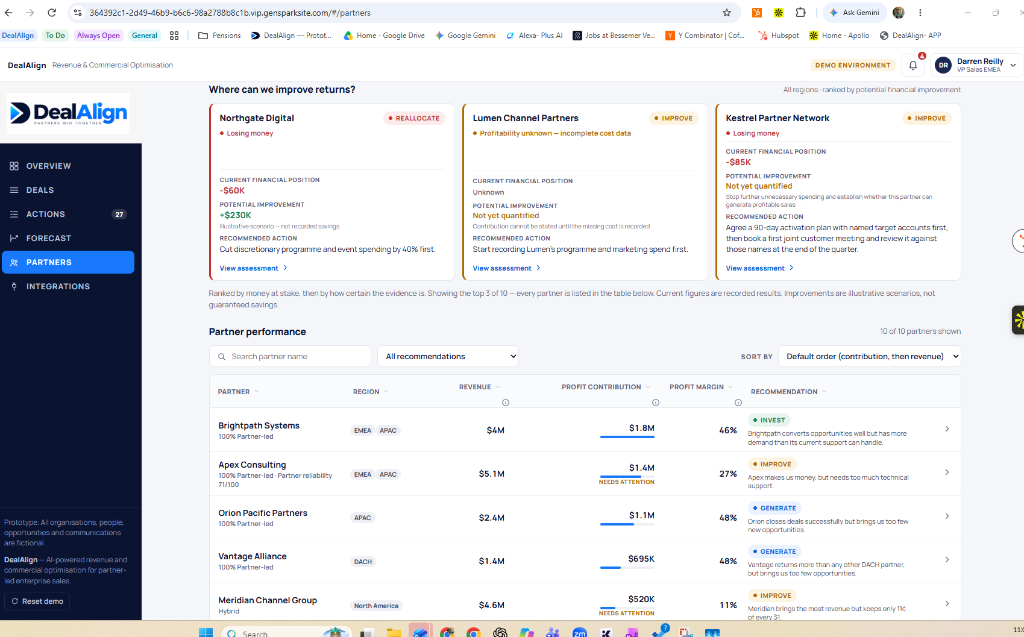
What this demonstrates, and what it does not. The figures above are a reproducible calculation on fictional data. They show how cost attribution, contribution, margin and the recommendation logic behave. They are not a customer result, not audited accounts, and not evidence of realised savings or proven profit uplift. DealAlign does not claim validated ROI for any organisation using it.
Related guides
See the profitability model against your own partner structure
A conversation is a working discussion, not a pitch. We can talk through which partner costs you can currently evidence, where contribution is likely being averaged away, and what the MVP demonstrates today.
See the profitability walkthrough Request a demonstration