
Partner Profitability
Why High-Revenue Partners Can Be Unprofitable
The largest partner on your list is not necessarily the most valuable one. Sometimes the revenue is real, the margin is thin, and the cost of supporting it quietly exceeds what it returns.
A high-revenue partner can be unprofitable because revenue says nothing about the cost of earning it. Large partners typically negotiate deeper discounts and rebates, demand more presales and engineering time, generate more support load, and often take the deals that need the most customisation. If you measure partners on revenue alone, you will keep funding whoever is loudest. Measure net contribution instead — gross profit less every partner-specific cost — and rank partners on that.
This is not an argument against large partners. Scale is valuable, and some of your biggest partners will also be your most profitable. The point is that the two things are not the same, and treating revenue as a proxy for value guarantees you will misallocate.
The mechanisms that make big partners expensive
- Discount and rebate escalation. Volume commitments are bought with price. A partner negotiating five points more discount on a large base can erase most of the margin the volume was supposed to create.
- Presales intensity. Large partners bring larger, more complex deals, which consume disproportionately more solution-engineering and executive time.
- Customisation. Big deals attract bespoke requirements, and bespoke work rarely stays inside the deal it was built for.
- Support and escalation load. A partner with a large installed base generates support volume in proportion to the base, not in proportion to the margin.
- Relationship cost. Dedicated account management, joint planning, executive sponsorship and marketing development funds all scale with partner importance.
- Payment and credit terms. Longer terms and higher return rates tie up working capital that has a real cost.
The arithmetic that matters
| Line | Partner A | Partner B |
|---|---|---|
| Revenue | $6,000,000 | $9,000,000 |
| Gross profit (30%) | $1,800,000 | $2,700,000 |
| Commissions and rebates | −$270,000 | −$810,000 |
| MDF and joint marketing | −$60,000 | −$320,000 |
| Partner account management | −$120,000 | −$260,000 |
| Presales and solution engineering | −$180,000 | −$640,000 |
| Support and servicing | −$140,000 | −$520,000 |
| Training and enablement | −$50,000 | −$150,000 |
| Net partner contribution | $980,000 | $0 |
| Contribution margin | 16.3% | 0.0% |
Partner B is 50% larger and produces nothing. The gross margin percentage is identical; what differs is the cost base. In this example Partner B's partner-specific costs are roughly three times Partner A's while its revenue is only 1.5 times as large, which is enough on its own to eliminate the extra gross profit. That pattern — cost growing faster than revenue — is what makes a revenue-ranked partner list actively misleading. It is not inevitable: a large partner with disciplined discounting and proportionate support can be very profitable. The point is that you cannot tell from revenue which kind you have.
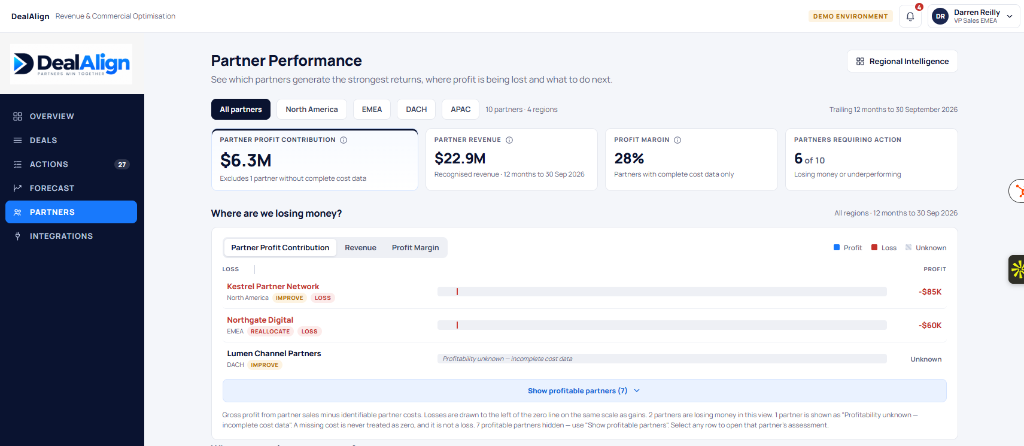
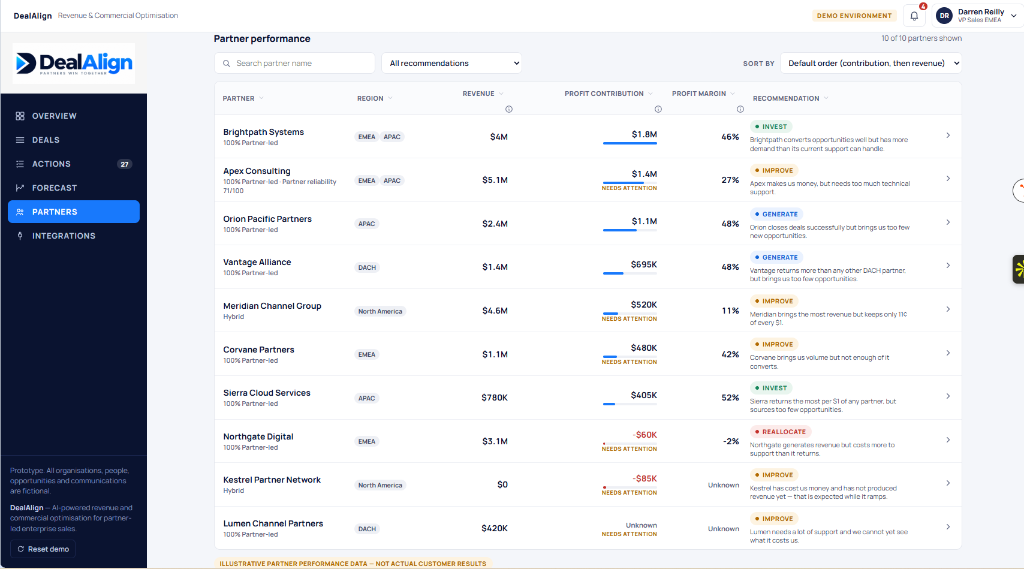
Real DealAlign screen: partners ranked by contribution rather than revenue, which immediately separates the ones worth growing from the ones worth renegotiating. Illustrative data — fictional organisations and figures.
How to test whether a partner is actually profitable
- Start from gross profit, not revenue. Revenue minus cost of goods sold. If you cannot get to gross profit by partner, that is the first gap to close.
- Attribute partner-specific cost. Commissions, rebates, MDF, named account management, presales time, support tickets and enablement spend. Where a cost is shared, allocate it on a stated basis and be consistent.
- Include the cost of capital tied up. Payment terms and returns consume working capital; a large partner on long terms is more expensive than the same revenue on short terms.
- Compare contribution margin, not absolute contribution. A large partner can produce a large absolute number and still be a poor use of the resources it consumes.
- Flag where data is estimated. A contribution figure built half on estimates is still more useful than none, provided you label it. See how to calculate partner profitability.
The comparison that changes the conversation
Cost to serve ratio =
partner-specific operating cost
÷ partner-attributable gross profit
A ratio above 1.0 means you are spending more to serve the partner than the partner's gross profit covers. Between roughly 0.5 and 1.0 is a partner worth fixing. Below 0.5 is a partner worth growing. The thresholds are yours to set — the value is in comparing partners on the same basis rather than arguing about revenue.
When gross profit is zero or negative. The ratio is undefined, not infinite, and it must not be reported as a large number that outranks every other partner in a sort. A partner whose attributable gross profit is zero or below fails the test before cost is even considered — report it as "no gross profit" and handle it as a separate case. Both figures must also be on the same basis: gross profit net of the same discounts and rebates that appear in the cost numerator, otherwise those costs are counted twice.
Real DealAlign screen: the cost breakdown behind a contribution figure, so a conversation with a partner about margin is grounded in specific line items rather than a blended percentage. Illustrative data — fictional organisations and figures.
What to do about an unprofitable large partner
Dropping a major partner is rarely the right first move. In most cases the revenue is worth keeping and the cost structure is what needs to change. Work through these in order:
| Lever | What changes | Risk |
|---|---|---|
| Re-price the commercial terms | Reduce discount or rebate depth; introduce a floor margin | Partner may push back or escalate |
| Change the service model | Tiered support, self-service enablement, paid presales beyond an allowance | Needs clear communication and consistency |
| Shift the mix | Incentivise higher-margin products or attached services | Takes time; requires partner cooperation |
| Reduce the cost of the relationship | Fewer dedicated resources, less bespoke joint marketing | May weaken the relationship |
| Reallocate territory or volume | Give part of the book to a partner with a better cost structure | Commercially sensitive; usually a last resort |
The order matters because the first two levers preserve the relationship. Most unprofitable large partners become profitable through commercial terms and service design, not through exit. See reducing the cost of managing channel partners for the cost side in more detail.
Why this is hard to see in practice
Most channel organisations cannot answer "which partners are profitable" without a project. The reasons are structural: commissions sit in finance, presales time sits in a services system, support sits in a ticketing tool, marketing sits in a budget line, and nobody joins them to a partner identifier. Revenue, by contrast, is right there in the CRM, which is why it becomes the default measure.
The fix does not require perfect data. It requires one partner identifier applied consistently across those systems, and a stated allocation basis for shared cost. That is a manageable piece of work, and it changes which partners get investment.
Key takeaways
- Revenue ranks loudness, not value. Rank partners on net contribution instead.
- Discounts, presales, customisation and support all scale faster than revenue in large partner relationships.
- Identical gross margin percentages can produce opposite contribution margins once partner-specific costs are attributed.
- Cost-to-serve ratio above 1.0 means the partner consumes more than it returns.
- Fix before exiting: re-price, restructure the service model, shift the mix.
Frequently asked questions
Does this mean we should stop investing in large partners?
No. It means large and profitable should be checked separately. Some of your largest partners will be your best contributors; the point is to know which is which rather than assuming size implies value.
How accurate does our cost data need to be?
Accurate enough to rank partners consistently. If two partners' contribution figures are $1.9M and $2.0M, estimation error matters. If they are $0.98M and $0.0M, it does not. Label estimated figures so the conversation stays honest.
Should we share profitability data with partners?
Share the shape, not the detail. Telling a partner that presales intensity and support volume are consuming their margin is legitimate and actionable. Sharing your full cost model is usually not necessary and can be commercially unwise.
What if a partner is unprofitable but strategically important?
That can be a valid decision — market entry, reference accounts, competitive defence. Make it an explicit, reviewed decision with a named owner and a review date, rather than an unexamined default. Strategic value should be argued for, not assumed.
Find out which partners actually make you money
Our MVP is ready. We can show you how partner profitability, cost attribution and contribution ranking work using your own partner structure.
How this guide was written
This is a practitioner guide, not a research paper. It is written from direct experience of running and advising channel partner programmes, and is intended as a structure for your own analysis rather than as evidence about your business.
- No external statistics. There are no survey results, benchmark figures or market-size claims in this article. Any number you see is either a worked illustration using clearly hypothetical figures, or a threshold we set ourselves and label as such.
- Heuristics are labelled. Where a score, weight or cut-off appears it is a founder-developed starting point, not a validated model. Calibrate it against your own data before relying on it.
- No customer results are claimed. Screenshots show illustrative data with fictional organisations. No named customer, deal or outcome is presented, and no performance improvement is implied.
- Borrowed frameworks are named. Where a guide uses an established method — for example the MEDDPICC qualification structure, or the standard management-accounting definitions of gross profit and contribution margin — it is named so you can consult the primary source rather than take our summary of it.
Related guides
Partner Profitability
How to Calculate Partner Profitability
From revenue to net contribution, with a worked example.
Partner Profitability
How to Reduce the Cost of Managing Channel Partners
Where partner management cost accumulates, and what to cut.
Partner Profitability
How to Decide Which Channel Partners to Invest In
A decision matrix for partner investment.
Related reading
Product page
See net contribution and margin per partner, including partners at negative contribution.
Channel partner profitability software →