How the three outcomes work together
Partner sales are managed at three levels at once: the deals and regions you are accountable for, the next actions that decide whether those deals move, and the partners whose performance and profit you depend on. They all run on the same connected data, so a regional sales number reconciles with the actions underneath it and the partner profit behind it.
1. Increase Partner Sales
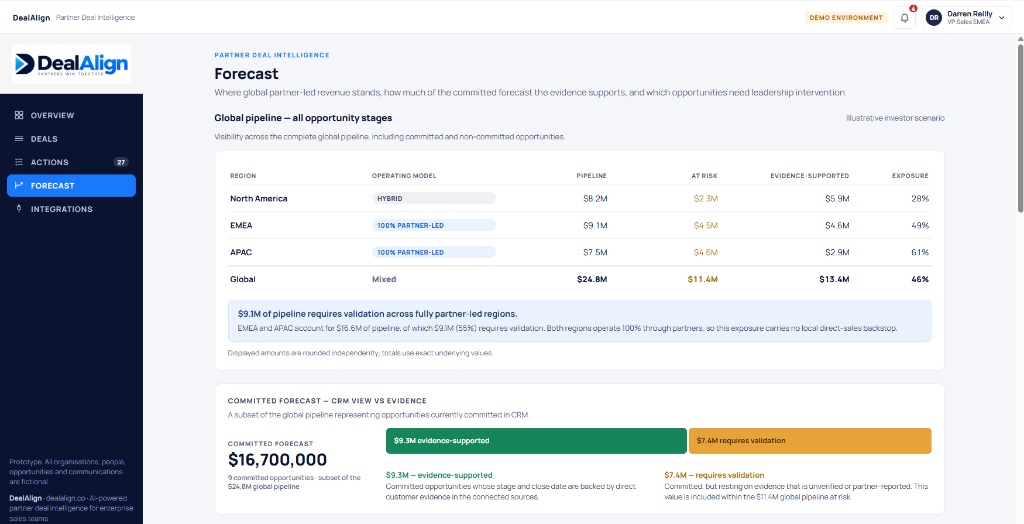
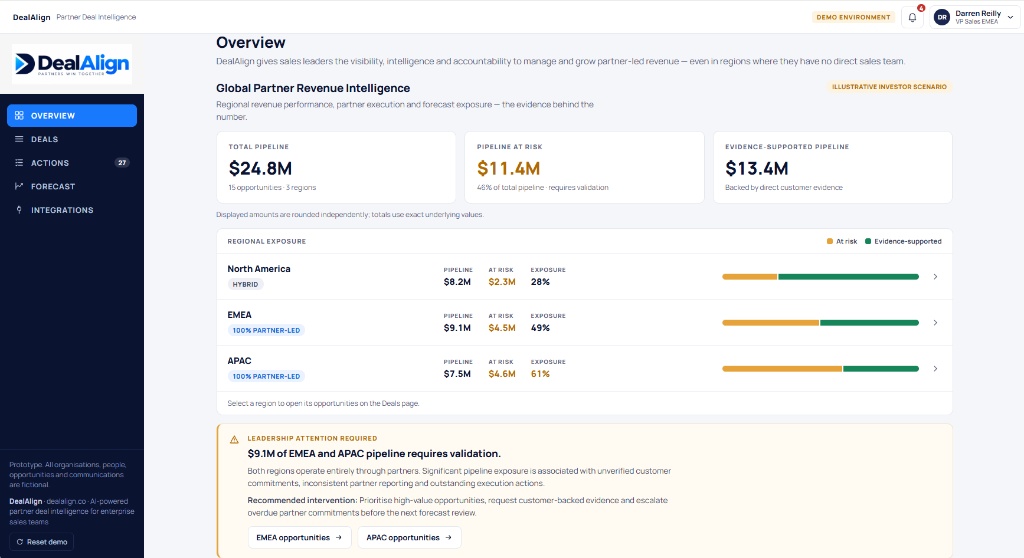
Identify deals at risk, improve win rates and grow sales through partners across different regions. Partner pipeline, at-risk value and the strength of the evidence behind each deal in one view — including territories run entirely through partners, where you have no local sales team to fall back on.
- What it does — shows partner pipeline, at-risk value and evidence strength for each region side by side.
- Why it matters — regions without direct coverage are where sales risk hides longest.
- What you get — earlier warning of deals at risk, clearer priorities for action, and growth in regions without hiring a full local sales team.
2. Improve Partner and Sales Team Collaboration
Help sales teams and partners understand what needs doing, who is responsible and how to move deals forward. Every next step has one named owner — your seller, your partner manager or the partner themselves — with a due date and a status you can follow.
- What it does — tracks actions across your team and your partners, and shows which are overdue or blocked on the partner.
- Why it matters — partner deals stall because nobody can say who owns the next step.
- What you get — fewer stalled deals, less duplicated effort and faster progress on opportunities already in the pipeline.
3. Improve Partner Profitability
Understand which partners generate profit, which cost too much to support and where to invest resources. Partner performance history sits alongside the opportunity, so a confident partner update can be read against what that partner has actually delivered before — and the same record shows what they contribute financially.
- What it does — shows how accurately the partner has forecast before, whether their updates match the evidence, how quickly they respond and how often they miss promises.
- What it costs — shows partner net contribution and profit margin, and flags incomplete cost data as unknown rather than zero.
- Why it matters — a partner update is only as credible as the record behind it, and strong revenue can hide a partner that costs more to serve than it returns.
- What you get — more reliable forecasting, earlier warning of recurring problems, and better decisions about which partners to back.
Ready today, planned next. Partner performance scoring is built and working, but it runs on illustrative history only. DealAlign has not accumulated real customer history, and no validated predictive accuracy is claimed. Learning from your own historical partner performance is a planned capability.
From partner revenue to net partner contribution
High revenue does not mean high profit. A partner can generate significant revenue while consuming disproportionate resource through commissions, discounts, presales, support, enablement and joint marketing. Read as a revenue line, that partner looks like a success. Read against its real costs, it may be losing you money on every deal.
DealAlign treats partner profitability as its own question, separate from sales revenue. Net partner contribution is the gross profit a partner’s own sales produce once that partner’s costs are taken off — the commissions, discounts and rebates, market development funds and joint marketing, partner account management, presales and sales engineering, support and servicing, training and enablement, and other operating costs incurred in serving that partner. Each cost is counted once, at the partner it relates to: nothing is deducted twice, and no cost already inside gross profit is charged again. Dividing that contribution by the partner’s recognised revenue gives the profit margin.
With contribution and margin side by side, leadership can separate the two failure modes that a revenue report merges together: insufficient revenue, and excessive operating cost. A partner with a healthy margin but little demand needs different action from a partner with strong revenue and a thin or negative margin.
Recommendations leadership can act on
DealAlign recommends one of four actions for each partner: INVEST, IMPROVE, GENERATE or REALLOCATE OR EXIT. Each recommendation explains the problem, supporting evidence, proposed action and expected commercial benefit.
Recorded, estimated and unknown are kept apart
Cost data is rarely complete, so DealAlign distinguishes recorded costs from estimates and allocated costs, and treats a missing cost as unknown rather than zero. A partner whose cost data is incomplete is reported as unassessed instead of being shown as profitable or as a loss. Incomplete data is never presented as precise financial truth.
What is demonstrated, and what is not. Partner profitability is shown through the working prototype using fictional partner data. The financial figures are illustrative calculations, not audited accounts, and improvement scenarios are labelled as scenarios. DealAlign makes no claim of realised savings, validated ROI or proven profit uplift for any customer.
Beyond the record: where this is intended to go
DealAlign’s intelligence direction extends beyond CRM fields to the conversations and collaboration around a deal — sales call transcripts, Microsoft Teams, Slack, email and partner or buyer interactions. Those sources are the design intent and are not live integrations in the product today. The prototype demonstrates the intelligence model using recorded demonstration data.
Evidence underneath all three
The three outcomes share one foundation: reconciling what the seller, the partner and the buyer each report against the evidence behind it. That is where a CRM field marked complete can turn out not to be customer-confirmed.
The four-stage workflow
Whichever outcome you are looking at, the underlying workflow is the same four stages: find the truth, fill the gaps, drive action and forecast with confidence. They describe how DealAlign operates, and they are what produces the three outcomes at scale.
Practical questions
What information is DealAlign designed to analyse?
Partner-led opportunity and commitment data, the evidence behind each qualification answer, partner reliability history, and the attributable costs of serving a partner — commissions, discounts and rebates, market development funds, presales and support, enablement and other partner-attributable operating costs. The prototype works from recorded demonstration data rather than a live customer system.
What does the current prototype demonstrate?
Regional exposure and evidence-supported pipeline, commitments with owners and due dates across company boundaries, partner reliability scoring, net partner contribution and contribution margin, and a recommendation per partner — all using fictional demonstration data. It is a working prototype, not a production deployment.
Which capabilities or integrations are still planned?
CRM, call-transcript, Microsoft Teams, Slack and email integrations are not live. They describe the intended direction. Learning from a customer’s own recorded partner history is also a planned capability, and no production-scale reliability data exists yet.
What does an initial conversation involve?
A working discussion about how you manage partner-led revenue and partner profitability today, where the exposure sits, and how DealAlign approaches it. Where relevant we can walk you through the MVP and show you exactly what is built today. It is not a demonstration of financial results, and no savings, recovered revenue or ROI is promised.
The three outcomes, each in detail
Each outcome answers a distinct commercial question, and each has its own page explaining the inputs, the analysis, the outputs and what the MVP demonstrates today:
Inputs, analysis and outputs
Stated plainly, so you can judge whether the MVP fits your data before investing time in a conversation.
Required inputs, and where they come from
- Partner-led opportunities — account, partner, value, stage, owner and close date.
- Evidence behind each qualification answer — whether a fact is customer-confirmed, internally asserted or partner-reported.
- Shared actions — the next step, responsible party, owner, due date, status and dependency.
- Partner-attributable costs — commissions, discounts and rebates, MDF and joint marketing, presales, support, account management and enablement, each with a completeness state of recorded, estimated or unknown.
Current data-intake method: the MVP works from a recorded demonstration dataset included with the product. It does not read from a live customer CRM, finance system or partner portal. That is the honest limitation, and the integration table below sets out what is planned.
What analysis is performed
- Reconciliation of seller, partner and buyer views against the evidence supporting each one.
- An illustrative deal score and risk level per partner opportunity, with an evidence state of aligned, gaps or conflict.
- Rollup of exposure and evidence-supported pipeline by region.
- Attribution of partner-specific cost, then net partner contribution and contribution margin per partner.
- A recommended action per partner: invest, improve, generate, or reallocate or exit.
Outputs and actions you can inspect
- A partner deal list sorted by evidence risk, showing why each deal is flagged.
- Open actions by opportunity, separating partner-owned from internally-owned work, with overdue and blocked distinguished.
- Partner contribution and margin, with cost completeness shown rather than assumed.
- Regional exposure, with the leadership attention panel for fully partner-led territories.
Integrations: what is live today and what is planned
Product maturity is a fair question, so the answer is a table rather than an adjective. Nothing in the planned column is available now, and none of it is described anywhere on this site as live.
| System or data source | Status | Current supported intake | Limitation |
|---|---|---|---|
| Demonstration dataset | Live today | Recorded dataset supplied with the MVP | Fictional organisations and figures; not your data |
| Salesforce (embedded plugin) | Planned | None — not available | Proposed only; no plugin exists today |
| HubSpot (embedded plugin) | Planned | None — not available | Proposed only; no plugin exists today |
| CRM data import (general) | Planned | None — not available | No live CRM connection today |
| Microsoft Teams | Planned | None — not available | Design intent only |
| Slack | Planned | None — not available | Design intent only |
| Email and call transcripts | Planned | None — not available | Design intent only |
| External AI assistant connector | Not built | None | Not available and not scheduled |
Product status and availability
Status as at 2 November 2026. The MVP is available for a guided demonstration. It is a working prototype, not a production multi-tenant deployment, and no customer is running it in production. The demonstration uses fictional organisations, people and figures throughout.
What you can evaluate today: partner deal risk views and evidence reconciliation, shared actions with owners and dependencies, partner contribution and margin with cost attribution, and regional exposure. You can walk through each of these on a call and see exactly what is built.
Pricing. DealAlign does not publish a price list. Commercial terms and any evaluation arrangement are discussed directly, because they depend on the partner structure and the data you can evidence. No free trial, licence fee or guaranteed pilot condition is offered or implied on this site.
Data handling during evaluation. Evaluating the MVP does not require you to supply customer data: the demonstration runs on the supplied fictional dataset. Website enquiries are handled as described in the privacy notice.
Where DealAlign is today
Our MVP is ready. The core capabilities described on this page — partner deal visibility, shared next actions across your team and your partners, and partner profitability — are built and working, and you can walk through them today.
MVP-ready does not mean every planned capability is finished. Partner performance history currently runs on illustrative data; learning from your own past partner performance is a planned capability. We label what is built and what is planned rather than overstating either.
Who this is for: partner-led industries
DealAlign is not a SaaS-only product. The problem it addresses appears wherever revenue reaches the end customer through someone else — a reseller, a distributor, a systems integrator or another third party. The partner structure changes; the underlying question does not.
- B2B software and technology — resellers and integrators who own the customer relationship and report progress your team cannot observe directly.
- Technology hardware — distributors holding stock and pipeline across territories, where sell-in and sell-through tell different stories.
- Medical equipment — manufacturers selling through specialist distributors into hospitals and clinics, where buying commitments are formal and hard to verify from a distance.
- Other indirect models — any business where a third party controls the opportunity and the evidence sits outside your systems.
Illustrative scenario, not a case study. A medical equipment manufacturer selling through distributors may not be able to see which opportunities distributors are actually progressing, whether a hospital buying commitment is genuine or provisional, which opportunities are at risk, how regional distributor performance compares, or whether a distributor relationship returns adequate financial contribution. That is an illustration of the problem. DealAlign claims no deployed medical-industry integrations and no medical-device customer outcomes.
CRM, PRM and DealAlign: which problem does each solve?
Buyers often arrive looking for “partner software” and find three different categories under that name. They are not substitutes, and DealAlign is not trying to replace the first two.
| Category | Primary job | Typical blind spot |
|---|---|---|
| CRM | Records pipeline, contacts and activity for deals your own team runs. | The record states what someone entered. It does not test whether the buyer has confirmed it. |
| PRM | Runs the partner programme: onboarding, tiers, deal registration, training, portals. | It administers the relationship; it does not reconcile per-deal evidence or partner-specific cost. |
| DealAlign | Compares partner-reported progress, your internal records and buyer evidence per opportunity, then attributes partner cost to show net contribution. | It is not a system of record, not a CRM replacement, and not a full PRM suite. |
In practice a company selling through partners usually runs all three questions at once: what is in the pipeline, how is the programme administered, and what is actually evidenced and profitable. DealAlign addresses the third.
Partner sales and profitability software: common questions
What is partner profitability software?
Software that calculates what each channel partner actually contributes after the costs of serving them. It differs from a revenue report because it subtracts partner-specific cost — commissions, discounts and rebates, market development funds, partner account management, presales and sales engineering, support, training and enablement — from the gross profit that partner’s sales produce, giving net partner contribution and contribution margin.
What is the difference between partner revenue and partner profitability?
Revenue is what a partner sells. Profitability is what remains for you after the cost of serving that partner. A partner can be the largest by revenue and the weakest by margin. On this site’s illustrative example, a partner with £3,200,000 revenue and £2,560,000 cost of goods produces £640,000 gross profit; £558,000 of partner-specific cost leaves £82,000 net contribution, or 2.6%.
Can DealAlign obtain every cost automatically?
No. Costs it cannot source are treated as estimated or unknown rather than assumed to be zero, and the difference is shown. CRM connectors and embedded Salesforce or HubSpot plugins are planned, not live; today the demonstration runs on a supplied dataset. The integrations table states exactly what is live and what is planned.
How does DealAlign differ from PRM software?
A PRM administers the partner programme: onboarding, tiers, deal registration, enablement and portals. DealAlign works on the evidence and economics of individual partner opportunities. It is not intended to replace a PRM, and it is not a full PRM suite.
What does DealAlign currently demonstrate?
A working MVP available for guided demonstration using illustrative data: partner deal risk with evidence reconciliation, shared actions with named owners, due dates and dependencies across a company boundary, partner net contribution and margin, and regional pipeline visibility. The MVP walkthrough shows each with genuine product screens and states what it does and does not prove.
Is DealAlign generally available?
No. The MVP is ready for guided demonstration. It is a working prototype rather than a production multi-tenant service, and no customer is running it in production. See product status and availability.
Related
More revenue. Higher profitability. Improve partner ROI from partner-led sales.
A conversation is a working discussion, not a pitch. We can talk through where partner-led revenue is exposed to slippage or poor conversion, where partner costs may be eroding contribution, and how DealAlign approaches both — and whether early validation participation is relevant for your team.
Talk to us