
Partner Profitability
How to Reduce the Cost of Managing Channel Partners
Partner management cost is rarely one big number. It is a dozen mid-sized costs spread across departments, none of which looks unreasonable alone, which is exactly why it accumulates without being challenged.
Reduce partner management cost by measuring cost to serve per partner, then removing the activity that does not change outcomes. The four biggest levers are: stop giving presales time away without a qualified deal; move enablement from bespoke delivery to repeatable self-service; replace recurring joint marketing with fewer, better-targeted campaigns; and cut the administrative overhead of reconciling data between systems. Most organisations find a meaningful share of partner cost is spent on partners who do not generate enough contribution to justify it.
It is worth being precise about the goal. The objective is not to spend less on partners. It is to stop spending on the wrong ones, and on activities that consume time without influencing a decision. A channel programme that costs less and produces the same revenue is a better programme; one that costs less and produces less revenue is just smaller.
Why partner management cost is hard to see
- It is distributed. Commissions sit with finance, presales time with services, support with operations, marketing with the marketing budget.
- It is not attributed. Without a consistent partner identifier across systems, cost cannot be tied to the partner that caused it.
- It is justified one line at a time. Each individual cost seems reasonable; the aggregate is never reviewed.
- It grows with relationship depth. The better the relationship, the more people are involved, and the more people are involved, the more it costs.
- Nobody owns it. Partner managers are measured on revenue, not on the cost of the resources they draw on.
The cost categories worth measuring
| Cost | What drives it | Usually recorded in |
|---|---|---|
| Commissions and rebates | Deal value, tier, volume commitments | Finance / commission system |
| Presales and solution engineering | Deal complexity, unqualified requests | Services time tracking |
| Support and servicing | Installed base, product complexity | Ticketing / support platform |
| Partner account management | Number of assigned managers, travel | Payroll / headcount plan |
| MDF and joint marketing | Number of campaigns, co-branded assets | Marketing budget |
| Enablement | Delivery method, number of bespoke sessions | Training / L&D budget |
| Administration | Manual reconciliation, dispute handling | Distributed across teams |
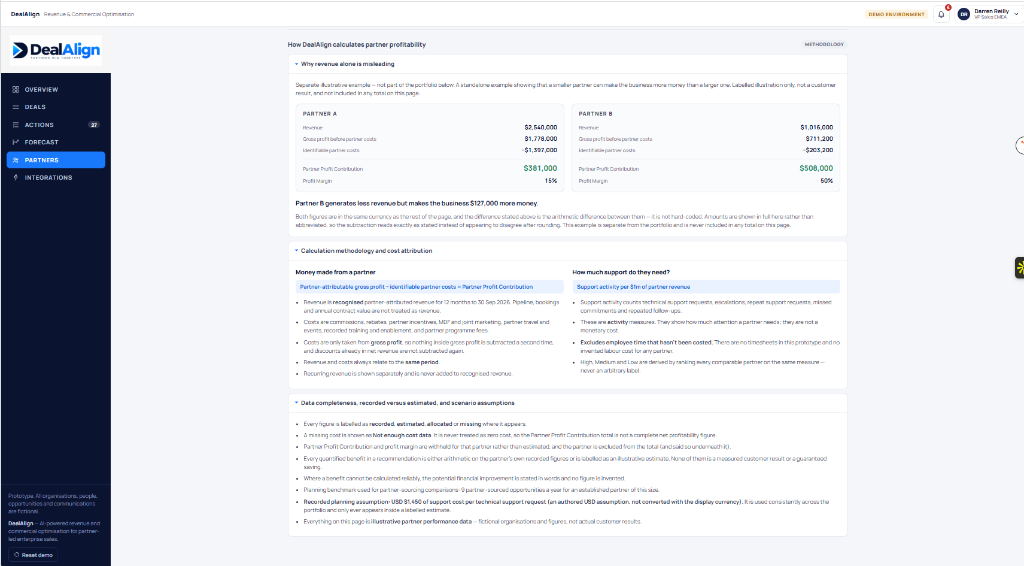
Real DealAlign screen: the calculation method stated explicitly, including how cost is attributed and whether each input is recorded, estimated or missing — which is what makes a cost-to-serve number defensible in a budget conversation. Illustrative data — fictional organisations and figures.
Four levers that reduce cost without reducing revenue
1. Gate presales time behind qualification
Presales is usually the largest controllable cost after commission, and the least governed. Requests arrive informally, nobody records the time, and a large share of the effort goes into deals that were never qualified. Introduce a minimum evidence standard before engineering time is committed: a named buyer, a defined requirement and a dated next step. Deals that cannot meet it are not refused — they go to self-service resources first.
2. Replace bespoke enablement with repeatable enablement
Delivering the same onboarding session for the ninth partner is a cost with no additional return. Record it once, structure it as short modules, and keep live time for the parts that genuinely need a person: deal reviews and competitive positioning. Measure adoption, not sessions delivered. See channel partner KPIs for how to track that.
3. Consolidate joint marketing into fewer, targeted campaigns
MDF is often allocated by entitlement and spent by habit. Ask what each campaign produced in registered pipeline, and reallocate toward the ones that did. A smaller number of campaigns tied to specific opportunities will generally outperform a broad programme of co-branded activity.
4. Remove the administrative overhead of reconciliation
If your team spends hours each week reconciling partner-reported figures against your own records, that is a real cost — and it is usually a symptom of having no shared record. The fix is structural rather than a cost cut: one deal record both sides update, rather than two systems that must be argued into agreement.
The calculation to run before cutting anything
Cost to serve ratio =
total partner-specific cost for the partner
÷ partner-attributable gross profit
The ratio rises as cost consumes more of the gross profit the partner generates, so a higher ratio is worse. Rank partners from highest to lowest and work down from the top: the partners at the top of that list are spending the most per unit of gross profit and are where a cost review will change the most. Partners at the bottom of the list are the cheapest to serve and should usually be protected, not cut.
Zero or negative gross profit must not enter the ranking. If a partner's attributable gross profit is zero, the ratio is undefined (division by zero). If it is negative, the ratio is arithmetically computable but commercially meaningless — two loss-making partners produce ratios whose order tells you nothing useful, and a spreadsheet will happily sort them as if it did. Treat both as a separate, higher-severity class:
- Gross profit zero → report "no gross profit" and exclude from the ratio ranking. The partner fails the profitability test before cost is considered.
- Gross profit negative → report "negative gross profit" and exclude from the ratio ranking. Act on pricing and mix first; there is no meaningful cost ratio to compute.
- Both → list them above the ranked table as their own category, so they cannot be out-ranked by, or hide behind, an ordinary ratio.
Never let a divide-by-zero render as a blank cell, a zero, or an infinity sign in a report someone will act on — a blank reads as "fine" and an infinity sorts to the top or bottom arbitrarily depending on the tool.
Worked examples
| Ratio | What it means | What to do |
|---|---|---|
| 0.2 | Cost is one fifth of gross profit — cheap to serve | Leave alone. Protect the service level; this partner funds the programme. |
| 0.6 | Cost absorbs three fifths of gross profit — mid-range | Review the largest single cost line. There is usually one avoidable driver. |
| 1.2 | Cost exceeds gross profit — the partner consumes more than it returns | Act first. Re-price, restructure the service model or renegotiate terms. |
Read in that order, the ranking is unambiguous: 1.2 is attended to before 0.6, and 0.6 before 0.2. A partner sitting above 1.0 is the priority regardless of how much revenue it reports, and one sitting at 0.2 is rarely worth a cost conversation at all. See why high-revenue partners can be unprofitable for the same arithmetic seen from the revenue side.
Running cost to serve analysis across the portfolio
The ratio above answers a question about one partner. Cost to serve analysis is the portfolio version: every partner measured on one convention, one period and one definition of which costs are attributable, so the output is a ranking you can act on rather than a set of individual calculations that cannot be compared.
Four things decide whether the analysis is usable.
- A single definition of attributable cost. If one partner's ratio includes allocated account management time and another's does not, the ranking reflects accounting policy rather than channel economics.
- The same denominator for every partner. Partner-attributable gross profit measured on recognised revenue for one partner and sell-in for another compares timing, not efficiency.
- Data quality published with the ratio. A ratio built on three recorded cost lines is not comparable with one built on three recorded and three estimated. Mark the estimated share, and never let an unknown cost be silently treated as zero — a partner with unpriced support will always look cheap to serve.
- An action per row. The end product is a decision: re-price, restructure the service model, gate presales behind qualification, or accept the cost because the partner converts it into gross profit efficiently.
Where cost to serve analysis most often changes a decision is not in the partners everyone already knows are expensive. It is in the mid-range: partners sitting at a ratio where one identifiable cost line — usually presales time or bespoke enablement — accounts for most of the excess. Those are fixed operationally rather than by renegotiating terms.
What the ratio does not tell you is whether the cost was worth paying. A partner with a high ratio may be opening a segment your direct team cannot reach; a partner with a low ratio may be doing very little. Cost to serve is an efficiency measure, and it should be read alongside net contribution and growth rather than on its own. That pairing is set out in how to calculate partner profitability.
A cost-reduction sequence that does not damage the channel
- Attribute cost first. Do not cut before you can see which partner and which activity caused the spend.
- Tier the service model. Define what every partner gets as standard, and what is earned. Publish it, so the boundary is a policy decision rather than a series of awkward conversations.
- Remove activity, not support. Cut duplicate reporting, redundant meetings and bespoke requests — not the responsiveness that partners actually value.
- Reinvest part of the saving. Put a share of what you cut into the partners with the lowest cost-to-serve ratios — the ones who already convert spend into gross profit most efficiently. This is what turns a cost programme into a growth programme.
- Review quarterly. Cost creeps back. A quarterly review of the cost-to-serve distribution keeps it honest.
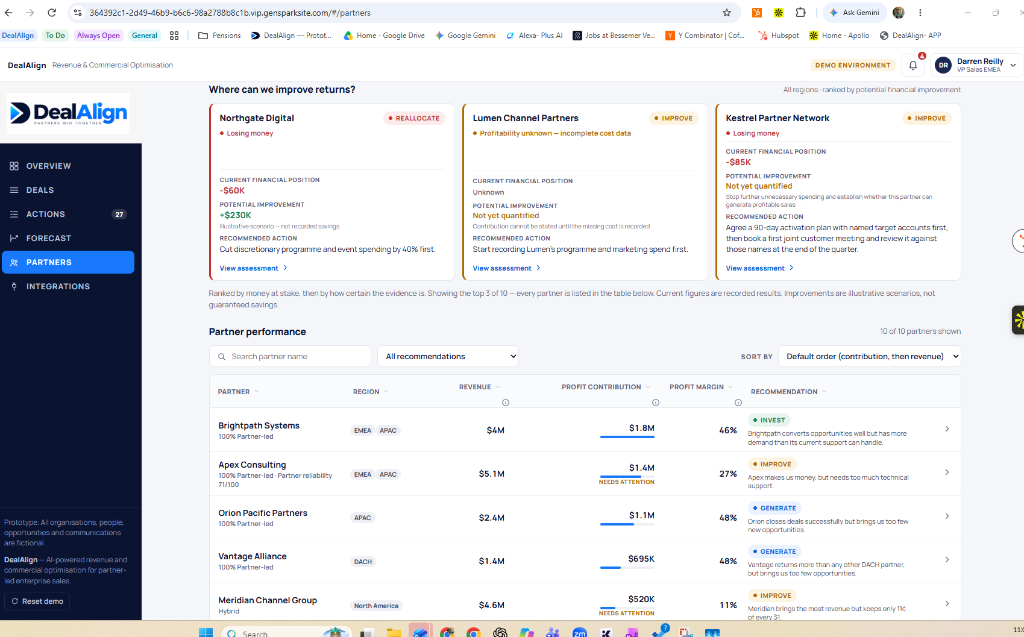
Real DealAlign screen: investment and incremental contribution side by side, which is the view that lets you defend a cost decision with numbers rather than instinct. Illustrative data — fictional organisations and figures.
What not to cut
Some costs look like overhead but are the reason the channel works. Be careful with:
- Responsiveness. A partner who cannot get an answer will route around you. Speed of response is cheap compared with the deals it protects.
- Deal-level reviews. The weekly discipline that catches slipping deals early is the highest-return use of partner management time there is.
- Onboarding of new partners. Underinvesting here creates a cohort that never ramps, which is more expensive than training them properly.
Key takeaways
- Partner management cost is distributed and unattributed, which is why it accumulates unchallenged.
- Presales time is the largest controllable cost and the least governed — gate it behind qualification.
- Repeatable enablement beats bespoke delivery at every partner beyond the first.
- Rank partners by cost-to-serve ratio, highest first, and work down from the top — a higher ratio means cost is eating more of the gross profit.
- Reinvest part of the saving in the partners with the best return, so the programme grows rather than shrinks.
Frequently asked questions
How do we start if we have never measured partner cost?
Start with commission and presales time, because those are usually the two largest and the two most tractable. Add support load next. You do not need a full cost model to begin; you need two lines that are consistently attributed, and a total that you can compare across partners.
Will reducing partner management cost damage relationships?
Reducing responsiveness will. Reducing duplication, bespoke delivery and unqualified presales generally will not — partners mostly notice speed and competence, not volume of activity. Communicate the service model clearly so partners know what to expect.
Should MDF be cut entirely?
Rarely entirely, but it should be earned and measured. Tie MDF to specific opportunities or campaigns with a defined pipeline outcome, require a report on what it produced, and reallocate from the campaigns that produced nothing.
Is it worth investing in tools to reduce partner management cost?
Only where the tool removes manual work that is actually being done. The strongest case is shared deal records, because it removes reconciliation across two systems and replaces it with one source that both sides update. See improving collaboration between sales teams and partners.
See where partner cost is actually going
Our MVP is ready. We can show you how cost attribution and contribution ranking work across a partner portfolio using your own structure. The profitability section of the MVP walkthrough shows the cost attribution screens, including how recorded, estimated and unknown cost data are kept apart.
How this guide was written
This is a practitioner guide, not a research paper. It is written from direct experience of running and advising channel partner programmes, and is intended as a structure for your own analysis rather than as evidence about your business.
- No external statistics. There are no survey results, benchmark figures or market-size claims in this article. Any number you see is either a worked illustration using clearly hypothetical figures, or a threshold we set ourselves and label as such.
- Heuristics are labelled. Where a score, weight or cut-off appears it is a founder-developed starting point, not a validated model. Calibrate it against your own data before relying on it.
- No customer results are claimed. Screenshots show illustrative data with fictional organisations. No named customer, deal or outcome is presented, and no performance improvement is implied.
- Borrowed frameworks are named. Where a guide uses an established method — for example the MEDDPICC qualification structure, or the standard management-accounting definitions of gross profit and contribution margin — it is named so you can consult the primary source rather than take our summary of it.
Related guides
Partner Profitability
How to Calculate Partner Profitability
From revenue to net contribution, with a worked example.
Partner Profitability
Why High-Revenue Partners Can Be Unprofitable
Large partner, thin margin: the arithmetic.
Partner Profitability
How to Measure Channel Partner ROI
What to include, and which decisions the number drives.
Related reading
Product page
Which operating costs belong to the partner, and how they reduce net contribution.
Channel partner profitability software →