
Partner Profitability
How to Decide Which Channel Partners to Invest In
Every channel team has more partners than it can support properly. The decision worth getting right is not which partners to have, but where to concentrate the finite resource of people, money and executive attention.
Decide which partners to invest in by scoring each one on four things: contribution margin, revenue growth, pipeline quality and cost to serve. Plot margin against growth on a simple two-by-two, and act by quadrant: invest in partners who are both profitable and growing; improve the profitable-but-stalled; fix the economics of partners who are growing but unprofitable before giving them any more demand; and reallocate from those weak on both. Score the whole portfolio twice a year, and make the allocation decision explicit rather than letting it happen by default.
Most channel teams do not lack partners. They lack the discipline to concentrate support on the ones that return it. The default outcome — everyone gets a partner manager, everyone gets the same onboarding, everyone gets an MDF allocation — feels fair and produces mediocre results across the board.
The four inputs that belong in the decision
| Input | Why it matters | Where it comes from |
|---|---|---|
| Contribution margin | Distinguishes revenue from value | Gross profit less partner-specific cost |
| Revenue growth | Separates a partner going somewhere from one standing still | Trailing four to eight quarters |
| Pipeline quality | Indicates whether growth will continue | Coverage and evidence state of open deals |
| Cost to serve | Reveals the real resource the partner consumes | Presales time, support load, account management |
Two further inputs are worth noting but should not dominate: strategic value (market entry, reference accounts, competitive defence) and partner commitment (willingness to invest their own resource). Both are real, both are easy to overstate, and neither substitutes for contribution margin.
Ranking by quadrant, not by list position
| Quadrant | Profile | Action |
|---|---|---|
| Invest | Strong margin, growing revenue | Concentrate resource: named manager, priority presales, first call on MDF |
| Improve | Strong margin, flat or declining revenue | Diagnose the stall — market saturation, enablement, or attention — before adding investment |
| Generate | Growing revenue, weak or negative margin | Fix the economics: pricing, service model, mix. Growth without margin compounds the problem |
| Reallocate | Weak on both | Reduce support to a standard tier; reinvest the resource elsewhere |
Validating the four quadrants with four partners
The matrix is only useful if every quadrant produces a different action. These four illustrative partners exercise all four:
| Partner | Revenue | Revenue growth (YoY) | Contribution margin | Cost to serve | Quadrant | Action |
|---|---|---|---|---|---|---|
| Northgate | $9.4M | +18% | 34% | 0.4 | Invest | Add resource |
| Apex | $7.8M | −4% | 31% | 0.5 | Improve | Diagnose the stall |
| Kestrel | $10.6M | +22% | −9% | 1.3 | Generate | Fix the economics |
| Meridian | $6.2M | −6% | −3% | 1.1 | Reallocate | Standard tier |
Read down the table and the four decisions are visibly different despite two pairs of similar margins. Northgate and Apex both return strong margin, but only Northgate is growing (+18% against Apex's −4%), so only Northgate earns additional investment. Kestrel and Meridian both return negative margin and both consume more than the gross profit they generate (ratios above 1.0), but Kestrel is growing at +22%, which makes fixing its economics worthwhile, while Meridian is shrinking at −6% and does not justify the effort. Revenue rank would have put Kestrel first and Meridian last; the matrix puts Meridian at the bottom, which is the correct commercial answer.
The critical point for Kestrel: strong growth is the reason to intervene on its economics, not a reason to feed it more demand. Giving a negative-margin partner more pipeline scales the loss. Fix pricing, service model and mix first, then grow.
How cost to serve and strategic fit change the decision
Cost to serve is what stops the matrix from being a revenue chart with extra steps. Two partners can post identical contribution margins and still deserve different treatment if one consumes twice the presales and support resource to get there. In the table above, Kestrel sits at 1.3 and Meridian at 1.1 — both above 1.0, meaning cost exceeds the gross profit they generate — which is why neither is a candidate for more investment, whatever their revenue says.
Strategic fit is the deliberate override, and it should be rare, explicit and time-limited. Legitimate uses are market entry into a territory you cannot otherwise reach, a reference account that unlocks a segment, or defending an account against a competitor. In each case record the reason, name an owner, and set a date at which the exception is reviewed. A partner kept for strategic reasons without that record is simply an unexamined subsidy, and it will drift out of the model entirely the following year because nobody can remember why it was there. Strategic fit carries only 0.1 in the weighted score below for exactly this reason: it can shift a close call, but it cannot carry a partner who fails on margin and growth.
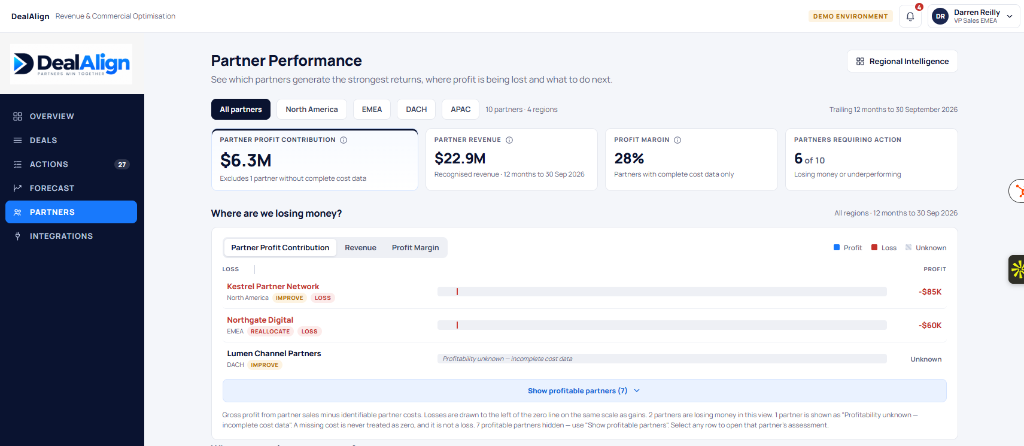
Real DealAlign screen: the profitability column that supplies the vertical axis of the matrix, and the ranking that makes the allocation decision arguable with evidence. Illustrative data — fictional organisations and figures.
A weighted score when you need a single number
Partner investment score =
(0.4 × contribution margin percentile)
+ (0.3 × revenue growth percentile)
+ (0.2 × pipeline quality percentile)
+ (0.1 × strategic fit percentile)
Use percentiles rather than raw values so the measures are comparable, and keep the weights stable across cycles. The weights are a judgement — the point is that they are an explicit, published judgement rather than an unstated preference. Do not let a single quarter's result move the weights.
How to run the review
- Fix the data window. Twelve months of revenue and margin, eight quarters of growth, current pipeline. Say which window you used.
- Score independently, then compare. Have partner managers score their own partners, and a central function score the same set. Differences are informative — they usually reveal missing context.
- Plot, then discuss the outliers. The matrix is the agenda. Partners in the middle need no discussion; the ones at the extremes need a decision.
- Decide resourcing in the room. Each partner gets a tier for the next two quarters — not a wish, an allocation of named people and budget.
- Write it down and tell the partner. Partners respond to clarity about where they stand. Ambiguity produces effort in the wrong places.
Avoiding the common mistakes
- Scoring on revenue and stopping there. Without margin, the scoring rewards the partner who consumes the most resource. See why high-revenue partners can be unprofitable.
- Treating strategic value as a wildcard. If a partner is unprofitable for strategic reasons, that should be a stated, reviewed exception with an owner and an end date — not a permanent exemption.
- Reallocating without communicating. Quietly reducing support is worse than saying so. Partners can plan around a clear tier; they cannot plan around slow replies.
- Reviewing annually. Partner performance changes faster than that. Twice a year, with a light quarterly check on the invest tier.
- Ignoring cost to serve because it is hard to measure. Even a rough attribution, clearly labelled as estimated, produces a better decision than a revenue-only ranking.
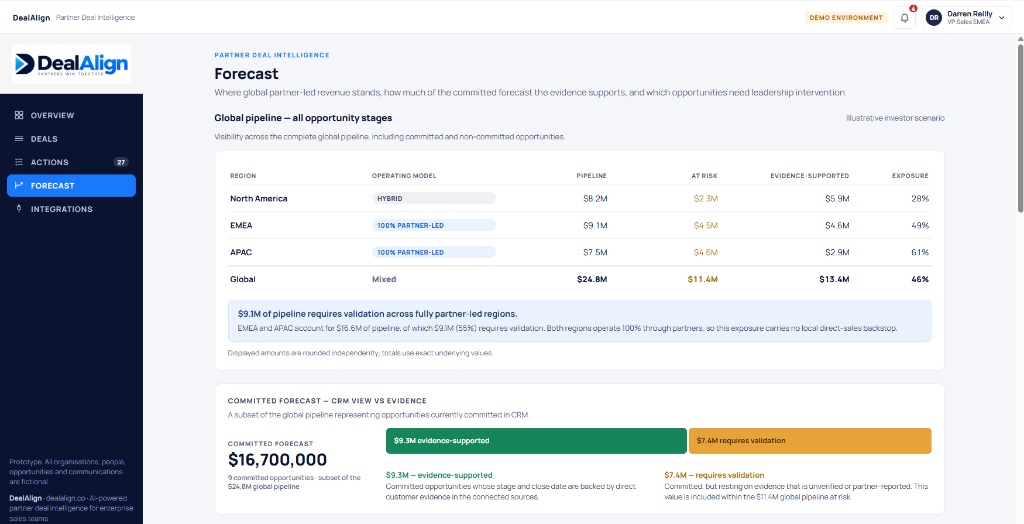
Real DealAlign screen: the pipeline-quality input to the score — coverage and evidence state by partner — so growth is assessed on what is actually committed rather than on what has been claimed. Illustrative data — fictional organisations and figures.
What investment actually means
"Invest" is often used vaguely. Make it concrete, because the allocation is the decision:
| Resource | What it looks like |
|---|---|
| Named partner manager | A dedicated person, not a shared queue |
| Presales priority | Guaranteed response times for qualified opportunities |
| Executive sponsorship | Scheduled contact with your leadership, not just reactive escalation |
| MDF and joint marketing | Budget tied to defined campaigns with expected pipeline |
| Enablement depth | Bespoke sessions, certification, joint account planning |
| Commercial terms | Better pricing, longer protection, earlier access to new products |
Every one of those is finite. Investing in one partner means not investing in another, and the purpose of the matrix is to make that trade-off visible instead of accidental.
Key takeaways
- Score on four inputs: contribution margin, growth, pipeline quality and cost to serve.
- Plot margin against growth and act by quadrant: invest, improve, generate, reallocate.
- Strategic exceptions should be explicit, owned and time-limited — not permanent.
- Make the resourcing concrete: named people, budget, priority, terms.
- Review twice a year, and tell partners where they stand.
Frequently asked questions
How many partners should be in the invest tier?
Only as many as you can resource properly. Work backwards from capacity: if you have six partner managers, you cannot give eight partners a dedicated manager. A tier you cannot fund is a promise you will break.
What if our data is too poor to score partners?
Score on what you have and mark the gaps. Revenue and pipeline are almost always available; margin and cost to serve are the common gaps. A matrix with two axes and one estimated is still far more useful than a ranking by revenue.
Should new partners be scored the same way?
No — new partners have no history to score. Assess them against ramp expectations instead: a defined ramp curve, milestone reviews and a decision point at which they either join the scored portfolio or return to a standard tier.
How do we handle a partner who disputes their tier?
Share the inputs and the method, not the internal debate. If a partner believes the margin is wrong, that is a data conversation worth having — and it is one reason to keep the calculation transparent. See calculating partner profitability.
See the matrix with your own partners
Our MVP is ready. We can show you how contribution margin, growth and cost to serve appear across a partner portfolio, using your own structure.
How this guide was written
This is a practitioner guide, not a research paper. It is written from direct experience of running and advising channel partner programmes, and is intended as a structure for your own analysis rather than as evidence about your business.
- No external statistics. There are no survey results, benchmark figures or market-size claims in this article. Any number you see is either a worked illustration using clearly hypothetical figures, or a threshold we set ourselves and label as such.
- Heuristics are labelled. Where a score, weight or cut-off appears it is a founder-developed starting point, not a validated model. Calibrate it against your own data before relying on it.
- No customer results are claimed. Screenshots show illustrative data with fictional organisations. No named customer, deal or outcome is presented, and no performance improvement is implied.
- Borrowed frameworks are named. Where a guide uses an established method — for example the MEDDPICC qualification structure, or the standard management-accounting definitions of gross profit and contribution margin — it is named so you can consult the primary source rather than take our summary of it.
Related guides
Partner Profitability
Why High-Revenue Partners Can Be Unprofitable
Large partner, thin margin: the arithmetic.
Partner Profitability
How to Reduce the Cost of Managing Channel Partners
Where partner cost accumulates, and what to cut.
Partner Profitability
How to Measure Channel Partner ROI
What to include, and which decisions the number drives.
Related reading
Product page
Contribution and margin turned into an invest, improve, generate or reallocate decision.
Channel partner profitability software →