
Partner Profitability
How to Calculate Partner Profitability
Revenue tells you what a partner sold. It does not tell you what you kept. This is the calculation that closes that gap — and the cost list most channel programmes leave out.
Partner profitability = the gross profit a partner's sales generate, minus every cost attributable to serving that partner. In practice: take partner-attributable gross profit, subtract commissions, discounts and rebates, MDF and joint marketing, partner account management, presales, support, onboarding and enablement. The remainder is net partner contribution. Divide it by the partner's recognised revenue to get contribution margin.
The hard part is not the arithmetic. It is deciding which costs belong to which partner, and being honest about the ones you cannot measure.
What channel partner profitability actually means
Three different numbers get called "partner profitability", and confusing them is the most common reason channel economics go wrong.
| Measure | What it answers | What it hides |
|---|---|---|
| Partner revenue | How much the partner sold | Everything about cost to serve |
| Gross profit | What is left after cost of goods | Commissions, presales, support, enablement |
| Net partner contribution | What the relationship actually returns | Only non-attributable overhead — which is the correct exclusion |
Revenue and gross profit are product-level measures that happen to be reported by partner. Net contribution is a partner-level measure, and it is the only one that supports a decision about where to invest.
The formula
Net partner contribution =
partner-attributable gross profit
− commissions − discounts and rebates
− MDF and joint marketing
− partner account management
− presales and sales engineering
− support and servicing
− training, onboarding and enablement
− other partner-specific operating costs
Then: Contribution margin = net partner contribution ÷ partner recognised revenue × 100. Two rules keep it honest. Count each cost once, at the partner it relates to — never deduct the same cost twice, and never re-deduct a cost already inside gross profit. And report a missing cost as unknown, not as zero.
Which costs to include
Include any cost that exists because you serve this partner, and that would fall if the relationship ended. The categories that usually matter:
- Commissions and rebates — the base margin you give away, including volume rebates and back-end incentives.
- Discounts attributable to the partner — deal-specific price concessions the partner negotiated, over and above standard channel pricing.
- Market development funds and joint marketing — events, campaigns, content and co-funded demand generation.
- Partner account management — the share of channel manager time that exists to manage this relationship.
- Presales and sales engineering — demonstrations, proof-of-concept work, solution design, tender responses.
- Support and servicing — tickets, escalations, implementation assistance and any second-line support the partner relies on.
- Training, certification and onboarding — both direct cost and the internal time to deliver it.
Exclude general overhead that would exist regardless of the partner — central finance, brand marketing, executive salaries. Allocating those tells you about your company, not about the partner.
A worked example
Take a partner with $5.1M of revenue and $2.1M of attributable gross profit (about 41%). Now deduct the costs of serving them:
| Line | Amount | Running total |
|---|---|---|
| Partner revenue | $5,100,000 | — |
| Attributable gross profit | $2,100,000 | $2,100,000 |
| Commissions and rebates | ($410,000) | $1,690,000 |
| Partner-attributable discounts | ($120,000) | $1,570,000 |
| MDF and joint marketing | ($60,000) | $1,510,000 |
| Partner account management | ($45,000) | $1,465,000 |
| Presales and sales engineering | ($28,000) | $1,437,000 |
| Support and servicing | ($22,000) | $1,415,000 |
| Training and enablement | ($15,000) | $1,400,000 |
| Net partner contribution | $1,400,000 | 27% margin |
A 41% gross margin becomes a 27% contribution margin. Neither number is wrong; they answer different questions. If you make investment decisions on the first, you will over-invest in partners who consume the most support.
The convention this example uses, stated explicitly so no cost is counted twice. The $2,100,000 is partner-attributable gross profit after cost of goods sold and after standard channel pricing. The discounts deducted below are therefore additional concessions negotiated on top of standard pricing — not the standard discount already reflected in the selling price. Commissions and rebates are treated as payments made to the partner in addition to the margin it keeps, not as a reduction of revenue already accounted for.
Two ways to get this wrong. If your gross profit figure is already net of volume rebates, deducting "rebates" again double counts them and understates contribution. If your recognised revenue is already net of deal-specific discounts, deducting "partner-attributable discounts" again does the same. Before you run this for real, trace one partner's numbers back to the ledger and confirm which figures are gross and which are net. Whichever convention you adopt, write it down and apply it identically to every partner — a portfolio ranked on two different conventions cannot be compared.
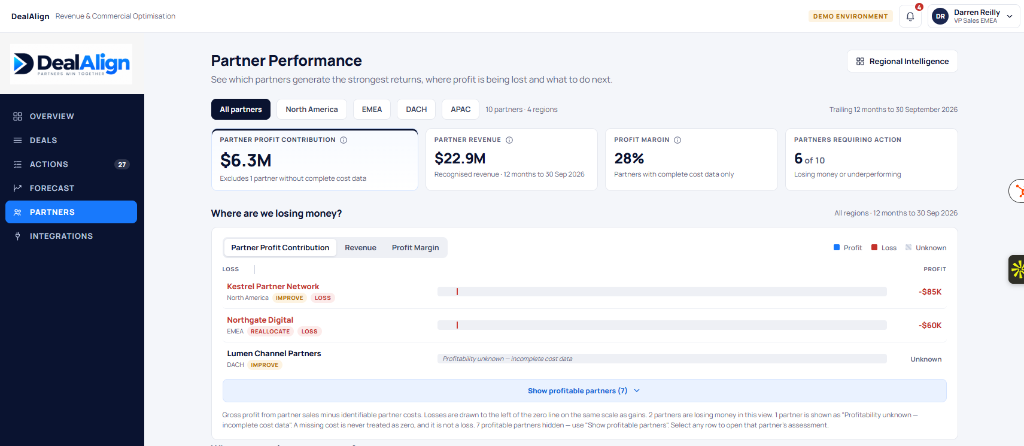
Real DealAlign screen: net partner contribution and contribution margin reported at portfolio level, with the partners losing money called out separately. Illustrative data — fictional organisations and figures, not customer results.
Why a high-revenue partner can be unprofitable
The partner above is healthy. Change three things and the same revenue becomes a loss: deeper discounts, heavier presales dependency, and a support burden that scales with the partner's volume. Revenue is unchanged; contribution turns negative.
This happens most often with the partners who look best on a revenue report, because those are frequently the partners selling complex, customised or heavily discounted deals. The mechanics are set out in why high-revenue partners can be unprofitable.
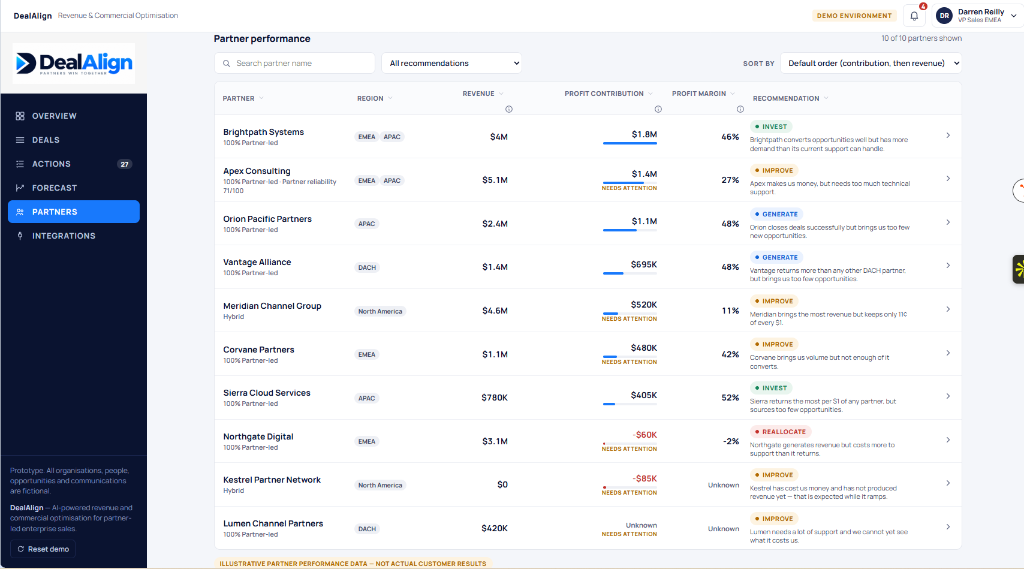
Real DealAlign screen: revenue, net contribution, profit margin and recommended action per partner. The margin column is what separates a large partner from a valuable one. Illustrative data — fictional organisations and figures.
Turning the calculation into a repeatable analysis
A single calculation answers a question about one partner on one day. Channel partner profitability analysis is the repeatable version: the same conventions applied to the whole portfolio, on a fixed cadence, producing a decision rather than a number. Four things separate the two.
- One convention, applied to everyone. The double-counting rules above must be identical for every partner. A portfolio ranked on two different conventions is not a ranking, it is two rankings spliced together.
- The same period for every partner. Mixing a partner measured on recognised revenue with one measured on sell-in produces a comparison that reflects timing, not performance.
- Data completeness reported alongside contribution. A partner showing 34% margin on three of six cost lines is not comparable with one showing 31% on all six. Publish the recorded, estimated and unknown split with the result.
- A decision attached to each row. The output of analysis is an action: invest, improve, generate demand, or reallocate. Contribution without a recommendation is reporting.
Quarterly is usually enough for the cost side, because partner-specific cost moves slowly. Contribution direction is worth watching monthly where you have the data, because a partner drifting from 20% to 8% over two quarters is easier to intervene on than one that arrives at negative contribution.
The four outputs most channel leaders act on are: partners whose margin is falling while revenue is rising; partners whose costs are largely unknown and therefore unranked; partners whose absolute contribution justifies investment even at modest margin; and partners whose margin and absolute contribution are both low, where the honest options are reallocation or exit. The investment decision framework is set out in deciding which partners to invest in.
What this analysis cannot tell you is why a cost is high. A partner with heavy presales consumption may be expensive because of deal complexity, because of weak pre-qualification, or because your own team is over-servicing. The contribution figure tells you where to look; it does not diagnose the cause.
Avoiding double counting and false precision
Two failure modes make partner profitability look more certain than it is.
Double counting
If a commission is already netted out of gross profit, deducting it again understates contribution. Build the calculation once, in one place, and state explicitly what gross profit already includes. The commonest error is deducting partner account management both as a cost and inside an allocated overhead charge.
False precision
Support cost per partner is often an estimate. That is fine — provided it is labelled as an estimate. Present a partner's contribution as three states: recorded (taken from a system), estimated (a documented allocation method) and unknown (no reliable basis). A partner with unknown costs should not be scored as highly profitable; unknown is not the same as zero.
Key takeaways
- Net partner contribution = attributable gross profit minus every partner-specific cost. Margin = contribution ÷ revenue.
- Include commissions, discounts, MDF, account management, presales, support and enablement. Exclude general overhead.
- Count each cost once at the partner it relates to.
- Label data quality as recorded, estimated or unknown — never treat unknown as zero.
- Revenue and contribution answer different questions; invest on contribution.
Frequently asked questions
What is channel partner profitability?
The profit a partner relationship generates after every cost attributable to serving that partner is deducted from the gross profit its sales produce. It is not partner revenue, and it is not gross margin — both of those sit above it.
Which costs should be included?
Commissions, discounts and rebates, market development funds and joint marketing, partner account management, presales and sales engineering, support and servicing, training, onboarding and enablement, and other operating costs incurred specifically in serving that partner. Each counted once.
How do I compare a large partner with a small one fairly?
Use contribution margin, not contribution value. A small partner at 35% margin is often a better use of incremental investment than a large partner at 12%. Compare margin alongside growth and absolute contribution, which is the approach in deciding which partners to invest in.
How can I measure partner ROI rather than just profitability?
Profitability measures a period; ROI measures the return on a specific investment. If you fund a partner's enablement or marketing, ROI compares that spend with the incremental contribution it produced. See how to measure channel partner ROI.
What if we do not have reliable cost data?
Start with what is recorded and estimate the rest using a documented method — for example, support cost per ticket multiplied by ticket volume for that partner. Label estimates as estimates. A directionally correct figure with visible assumptions beats a precise figure built on guesses.
See partner profitability calculated for you
Our MVP is ready. We can walk through how partner contribution, margin and recommended action appear side by side, using your own partner scenarios. You can also see the profitability section of the MVP walkthrough first, which states what the working product demonstrates and what it does not.
How this guide was written
This is a practitioner guide, not a research paper. It is written from direct experience of running and advising channel partner programmes, and is intended as a structure for your own analysis rather than as evidence about your business.
- No external statistics. There are no survey results, benchmark figures or market-size claims in this article. Any number you see is either a worked illustration using clearly hypothetical figures, or a threshold we set ourselves and label as such.
- Heuristics are labelled. Where a score, weight or cut-off appears it is a founder-developed starting point, not a validated model. Calibrate it against your own data before relying on it.
- No customer results are claimed. Screenshots show illustrative data with fictional organisations. No named customer, deal or outcome is presented, and no performance improvement is implied.
- Borrowed frameworks are named. Where a guide uses an established method — for example the MEDDPICC qualification structure, or the standard management-accounting definitions of gross profit and contribution margin — it is named so you can consult the primary source rather than take our summary of it.
Related guides
Partner Profitability
Why High-Revenue Partners Can Be Unprofitable
How support and discount costs turn a top seller into a net loss.
Partner Profitability
How to Reduce the Cost of Managing Channel Partners
Finding overspend without damaging revenue.
Partner Profitability
How to Measure Channel Partner ROI
What to include, and which decisions the number should drive.
Related reading
Product page
How DealAlign attributes partner-specific cost, then reports net contribution and margin.
Channel partner profitability software →MVP ready
See partner contribution and margin per partner, with recommended actions.
See it in action