
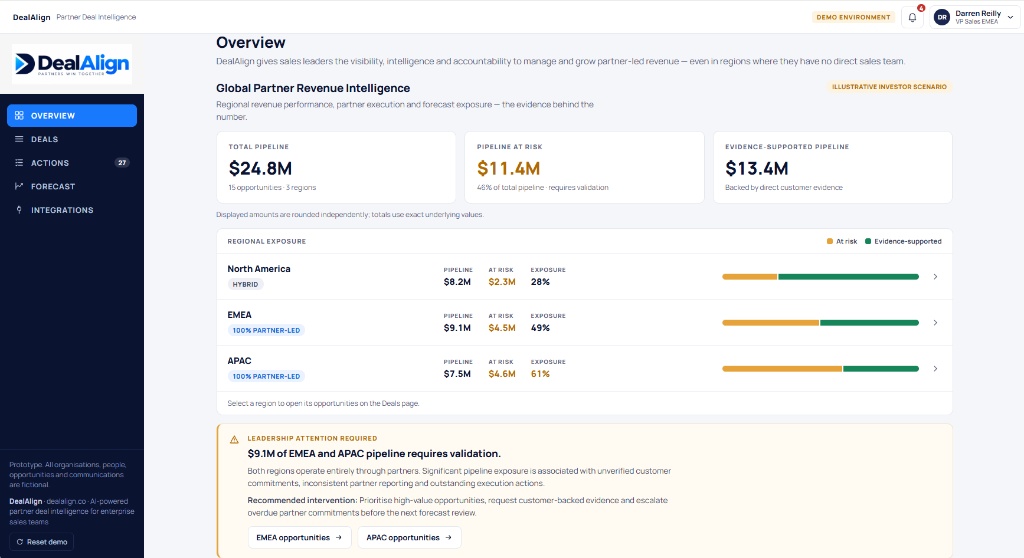
This walkthrough is dated 2 November 2026 and describes the MVP as it exists on that date. It is a working prototype available for guided demonstration, not a production deployment. Every screen below is genuine product output; every number in it is fictional demonstration data. The purpose is to let a buyer see exactly what is built, judge it against their own partner structure, and discount anything that is not evidenced.
Outcome 1: identifying and managing partner-led deal risk
The claim being evidenced is narrow: the product can show, per partner opportunity, whether the evidence supports the stage and value recorded against it. It is not claimed to predict which deals will close.
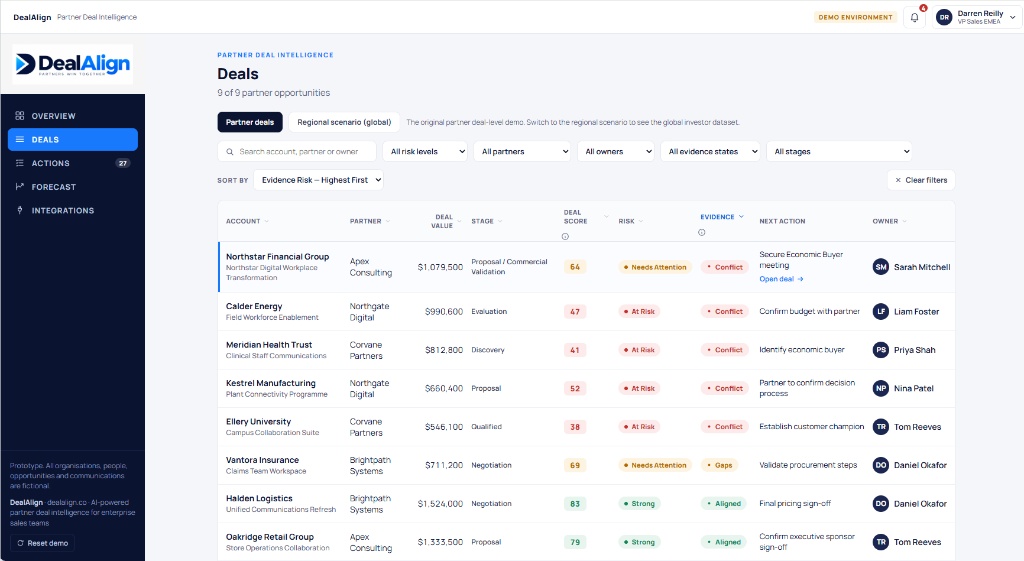
Partner deal risk management sets out the full method. In the screenshot below, nine partner opportunities are sorted by evidence risk. One row stands out: a $1,079,500 opportunity at proposal and commercial validation whose evidence state is conflict, with a next action to secure an economic buyer meeting. A deal cannot be in commercial validation while the budget holder is unconfirmed, and the record is carrying that contradiction visibly.
The reconciliation screen is where the conflict is explained rather than asserted. Below, the CRM records the economic buyer as confirmed while the evidence underneath does not support it.
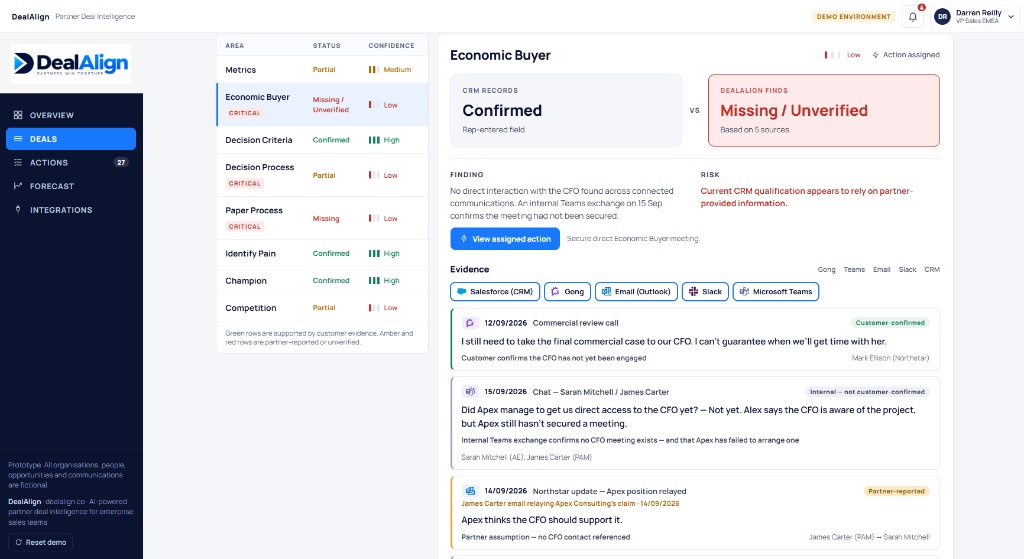
What this proves: the product can hold a deal record and its supporting evidence together, detect a contradiction, and present it in a way a reviewer can act on.
What it does not prove: that the deal score is predictive. The score and its risk bands are illustrative. No accuracy figure is offered because none has been independently established, and no automatic alerting or background CRM monitoring is claimed.
Outcome 2: assigning and reviewing shared sales and partner actions
The claim here is that accountability can be modelled across two companies on one record. The product holds each action against the opportunity it belongs to, with one named owner, a due date, a status and a dependency.
In the example below, the technical validation workshop is blocked rather than merely late, because it depends on a buyer signatory the partner has not confirmed. That distinction changes the response: chase the partner on the signatory, not on the workshop.
| Action | Responsible party | Due | Depends on | Status |
|---|---|---|---|---|
| Confirm buyer signatory and budget holder | Partner | 12 Nov | — | Overdue |
| Complete technical validation workshop | Your team | 15 Nov | Signatory confirmed | Blocked |
| Submit deal registration | Partner | 18 Nov | — | Open |
| Agree commercial terms with partner | Your team | 20 Nov | Deal registration approved | Open |
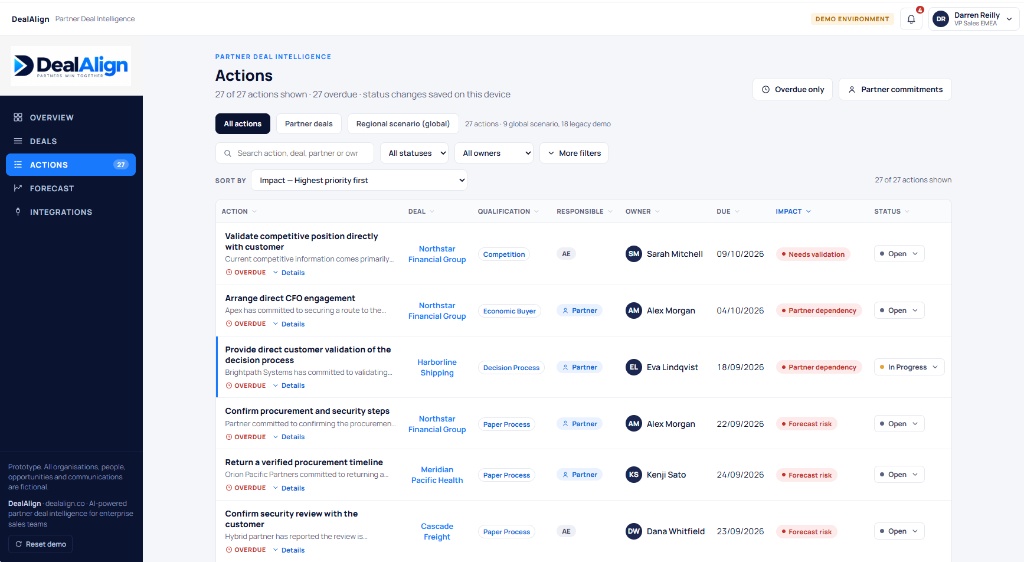
What this proves: commitments can be recorded and reviewed across the company boundary, with blocked dependencies distinguished from late ones.
What it does not prove: that DealAlign improves win rates or shortens sales cycles. No customer improvement figure is claimed. A live two-way sync with a partner's own systems is not available, and no embedded Salesforce or HubSpot plugin exists. See partner sales accountability for the full statement of what is and is not claimed.
Outcome 3: assessing partner profitability and financial contribution
The claim is that partner-specific cost can be attributed to each partner and compared, rather than blended into a single cost-to-serve percentage.
The worked example in channel partner profitability software is reproducible by hand: a partner with £3,200,000 revenue and £2,560,000 cost of goods gives £640,000 gross profit; £558,000 of partner-specific cost leaves £82,000 net contribution, or 2.6%. It is the largest partner by revenue and the weakest by margin, which is precisely the finding a revenue report hides.
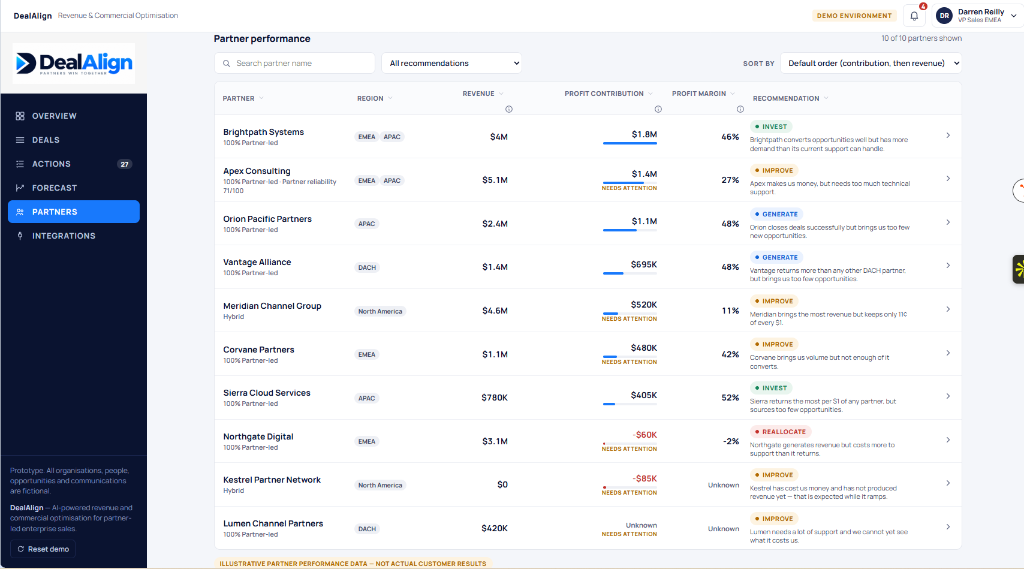
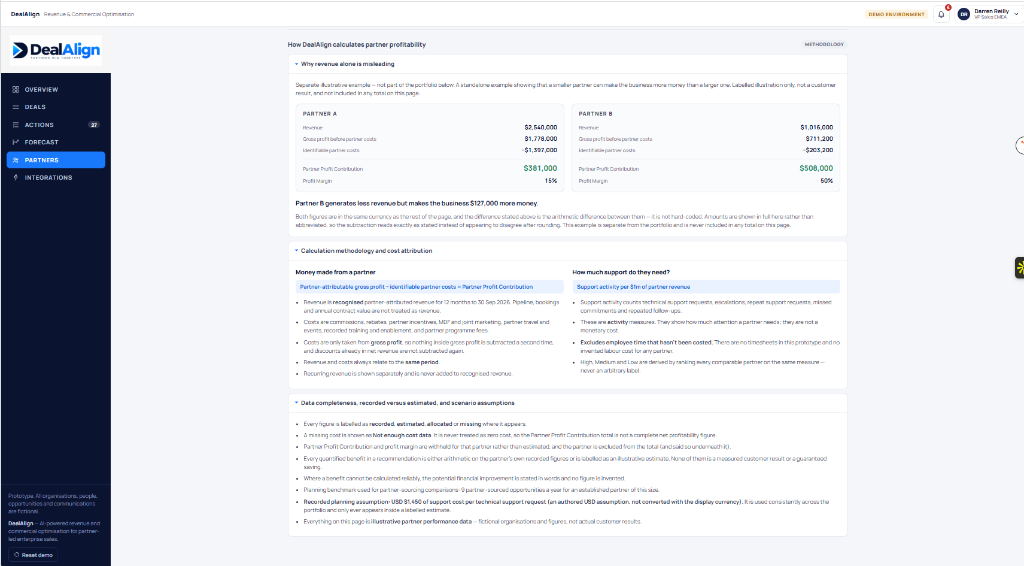
What this proves: cost attribution, net contribution, contribution margin and a per-partner recommendation can be produced and challenged, with data completeness visible.
What it does not prove: that any customer has realised a saving or improved margin. The figures are illustrative calculations on fictional data, not audited accounts and not a validated ROI claim.
What this walkthrough demonstrates, and what it does not
Across all three outcomes, what is evidenced is a working prototype that models partner deal evidence, cross-company accountability and partner cost attribution, and presents each in a form a commercial reviewer can act on.
What is not evidenced, and is therefore not claimed anywhere on this site:
- Any customer result, revenue improvement, margin improvement or realised saving.
- Predictive accuracy of the deal score, or any validated forecast model.
- Live integrations with Salesforce, HubSpot, Teams, Slack, email or call transcripts. An external AI assistant connector is not built.
- Production deployment, multi-tenant operation, or a partner-facing portal.
- Any security certification.
Design-partner engagement
DealAlign is working with design partners to test whether the problems described on this site are real commercial problems, and whether the MVP addresses them in a usable way. That is the whole claim, and it is deliberately modest.
One design-partner conversation concerns a medical equipment manufacturer selling through distributors. The difficulties raised there are common to partner-led businesses rather than specific to healthcare: limited visibility of which distributor opportunities are genuinely progressing, and performance reporting held together in spreadsheets across territories. It is an illustrative industry scenario drawn from a real conversation, not a named customer case study.
What is not claimed. No design partner is named, because none has authorised publication. No quote or testimonial is reproduced. No implementation has been completed, no measured return on investment exists, no revenue or margin improvement has been evidenced, no feedback beyond the conversations described above is implied, and neither organisation is a paying customer. No partner-supplied data appears anywhere on this site.
When an authorised design partner can publish, their evidence will be added here with its scope, date and basis, rather than as a generic quote.
How to evaluate it yourself
The most useful next step is a guided walkthrough on a call, where you can challenge the model against your own partner structure. You do not need to supply customer data: the demonstration runs on the supplied fictional dataset.
For the commercial detail behind each outcome, see partner deal risk management, partner sales accountability and channel partner profitability software. For product status, inputs and the integration table, see the product page.
Walk through the MVP with us
A conversation is a working discussion, not a pitch. We will show you exactly what is built today and be explicit about what is not.
Request a demonstration