
Partner Profitability
How to Measure Channel Partner ROI
Partner ROI is the one number that tells you whether a relationship is worth continuing. It is also the number most channel programmes calculate inconsistently, if at all.
Channel partner ROI = (post-investment contribution − pre-investment contribution) ÷ partner investment × 100. Two contribution figures are needed, not one. Pre-investment contribution is the partner's net contribution with the discretionary investment not yet made. Post-investment contribution is the same measure after the investment has been spent and charged. Subtracting the investment once, in arriving at the post-investment figure, is what keeps the calculation honest — if your contribution measure already includes enablement, MDF or presales costs, do not deduct them a second time.
The distinction that makes ROI different from profitability: profitability measures a period, ROI measures a decision. If you cannot say what the spend was for, you cannot calculate a return on it.
Pre-investment and post-investment contribution
Almost every error in partner ROI comes from mixing two different contribution figures, or from deducting the same cost twice. Being explicit about which figure you are using prevents both.
| Figure | What it includes | Where it comes from |
|---|---|---|
| Pre-investment contribution | Net partner contribution before the discretionary spend is made and charged | Prior period, or the counterfactual baseline |
| Post-investment contribution | Net partner contribution after the spend has been made and charged exactly once | The period in which the investment was incurred |
| Difference | The change the decision produced, net of its own cost | Post minus pre |
The rule to hold on to: if the investment is already inside your contribution figure, the ROI numerator already accounts for it. Deducting it again inflates or deflates the answer depending on which side you subtract it from, and neither version survives scrutiny.
What partner ROI means — and what it does not
ROI is a comparison of a decision against its counterfactual. That is both its power and its difficulty: to say an investment earned 239%, you need a defensible view of what would have happened without it.
Most channel programmes avoid this and substitute something easier — usually "partner revenue divided by partner spend". That figure is not ROI. It ignores whether the revenue would have happened anyway, and it uses revenue rather than profit.
| Measure used | Problem |
|---|---|
| Partner revenue ÷ partner spend | Uses revenue, not profit; ignores whether the deal needed the investment |
| MDF attributed pipeline | Pipeline is not revenue, and attribution is usually self-reported by the partner |
| Partner satisfaction score | Measures sentiment, not return |
| Cost per registered deal | Efficiency measure; a cheap deal that never closes is still a loss |
Which investments should be measured
Measure the spends that are discretionary and large enough to change a decision. In most channel organisations that means:
- Market development funds — co-funded campaigns, events and content.
- Dedicated presales and sales engineering — particularly where time is allocated to one partner.
- Enablement and certification — training delivery, materials and partner time subsidy.
- Partner account management — the share of channel manager cost actually spent on that relationship.
- Programme incentives — spiffs, rebate accelerators and back-end bonuses.
Do not try to measure ROI on baseline channel overhead such as partner portal licences. It is shared, non-discretionary and will not change a decision.
How to calculate it
Partner ROI % =
(post-investment contribution − pre-investment contribution)
÷ partner investment × 100
Post-investment contribution must already be net of the investment — that is where the spend is deducted, once. Pre-investment contribution is the same measure without the spend. If your contribution definition includes enablement, MDF or dedicated presales as operating costs, those amounts are already inside both figures, so do not subtract them again in the numerator. State the baseline method explicitly; it is the assumption every reader will want to test.
Worked example
A partner's pre-investment contribution is $1.2M. You spend $180k on enablement, MDF and dedicated presales, all of which are charged as partner-specific costs. In the following period the partner's post-investment contribution — already net of that $180k — is $1.75M.
| Line | Amount | Note |
|---|---|---|
| Post-investment contribution | $1,750,000 | Already net of the $180k |
| Pre-investment contribution | ($1,200,000) | Counterfactual baseline |
| Net gain | $550,000 | The investment is already deducted |
| Partner investment | $180,000 | Denominator only — not deducted again |
| ROI | 306% | $550,000 ÷ $180,000 |
The most common error at this point is to subtract the $180k a second time, which would give a net gain of $370k and an ROI of 206%. That number is not conservative — it is simply wrong arithmetic, because the spend was already inside the post-investment contribution. If instead your contribution definition excludes discretionary investment, the two contribution figures are gross of it and you must deduct it once. Pick whichever convention matches your ledger, state it, and apply it identically to both figures.
Reconciled against the profitability ledger in how to calculate partner profitability, the partner's net contribution is gross profit less commissions, discounts, MDF, account management, presales, support and enablement. Because enablement, MDF and presales are line items in that ledger, they are already inside any contribution figure it produces — which is precisely why they must not appear twice.
Using a stricter baseline — say the prior period grew 8% organically, so $1.296M would have happened anyway — the net gain falls to $454k and ROI to 252%. Both answers justify the spend; only one is defensible in a board paper. Show your baseline.
When investment is zero
If no discretionary investment was made, the formula has a zero denominator and ROI is undefined — not infinite, and not zero. Do not substitute a large number or treat it as a perfect score. Either report "no investment, ROI not applicable" and fall back to the contribution margin itself, or if you want a comparable figure, define a notional programme charge equal to the baseline account-management cost you already incur and disclose that you did so.
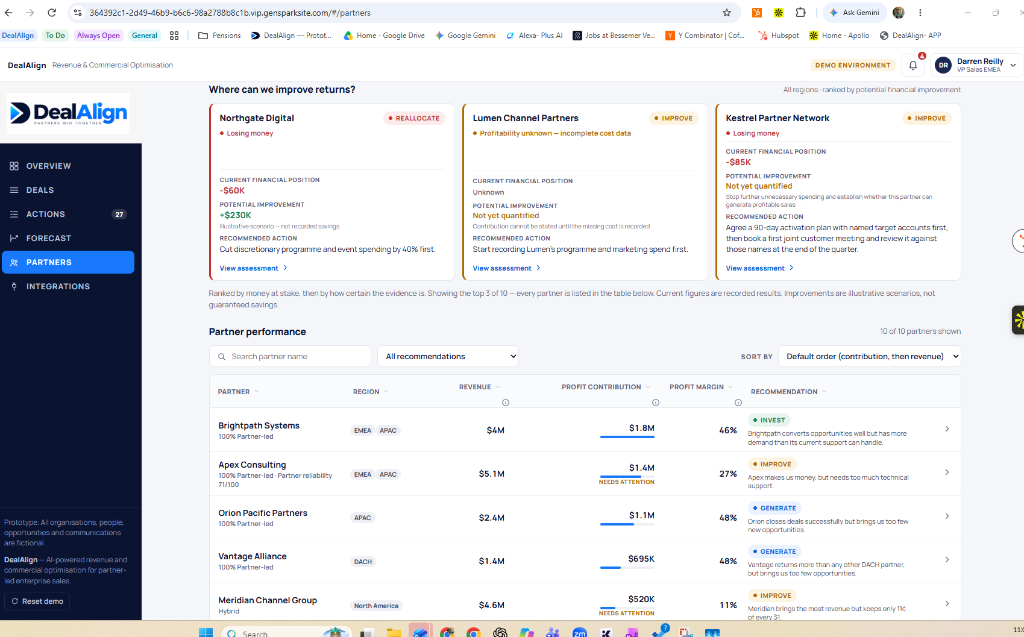
Real DealAlign screen: each partner recommendation carries the evidence behind it and the expected commercial benefit — the input you need before deciding whether more investment is justified. Illustrative data — fictional organisations and figures.
How to compare partner ROI across partners
Comparing raw ROI percentages across partners is tempting and usually wrong, because each partner starts from a different base. Three rules make comparison meaningful:
- Compare like with like. An established partner and a newly onboarded one cannot be judged on the same ROI horizon. Give new partners a defined ramp period and measure them against their own ramp target.
- Compare incremental contribution per unit of investment, not absolute contribution. A partner returning $3.00 of contribution per $1.00 invested (a 200% ROI) is more efficient than one returning $1.20 (a 20% ROI), even if the second is bigger.
- Compare on the same time window. Partner investments have different lags. Enablement pays back over quarters; event spend pays back in weeks. Matching windows avoids rewarding short-lag activities.
Illustrative only: return per unit of investment is the fairest comparison across partners of different sizes. The bars are a payback multiple — contribution returned per $1.00 invested — so 1.0× is break-even. Northgate's 3.4× is the same result as the 239% in the worked example: $610,000 returned on a $180,000 investment is 3.39×, and ROI % = (multiple − 1) × 100, so (3.39 − 1) × 100 = 239%. Read the chart as a multiple, report the formula as a percentage, and the two never disagree.
What decisions partner ROI should drive
A number that does not change a decision is decoration. Partner ROI should drive four:
- Where to add investment. Partners returning well above 1.0× on the payback-multiple basis — well above break-even, so well above a 0% ROI — with capacity to grow are the obvious candidates.
- Where to stop investing. A partner returning below 1.0× over a fair horizon has not covered the cost of the investment, and is consuming resource that another partner could use.
- Which activity to fund. If MDF returns 3× (200% ROI) and dedicated presales returns 0.8× (a 20% loss on the spend), the answer is not "more presales".
- What to fix before spending more. A partner with poor conversion will not improve because you spend more; fix conversion first.
This is the same logic set out in deciding which channel partners to invest in, and it depends on the cost base described in how to calculate partner profitability.
Common mistakes
- Using revenue as the return. Revenue without cost produces ROI figures that justify anything.
- Omitting the baseline. Crediting all of a partner's growth to your investment overstates return badly.
- Averaging across all partners. A blended channel ROI hides both the winners and the losses, which are the only things worth acting on.
- Measuring once. ROI is a running measurement, not an annual audit. Recalculate as contribution lands.
Key takeaways
- ROI = (post-investment contribution − pre-investment contribution) ÷ investment. The investment is deducted once — inside the contribution figures — and appears in the denominator only. It measures a decision, not a period.
- Calculate it on contribution, never revenue.
- State your baseline explicitly — every reader will test it.
- Compare return per unit of investment, within matched time windows.
- Measure only discretionary spend that could actually change.
Frequently asked questions
What is a good partner ROI?
There is no universal bar, but there is a floor: 1.0× — that is, a 0% ROI — is the point at which the investment merely returns more contribution than it cost. Anything above 1.0× is a positive return, and the right threshold above it depends on your cost of capital and the alternative uses of the money. Note the two ways of saying the same thing: a 1.4× multiple is a 40% ROI, and a 3.4× multiple is a 239% ROI. Beyond the floor, the more useful question is comparative: which partners and which activities return most per unit invested, and can you move budget from the weakest to the strongest.
How is partner ROI different from partner profitability?
Profitability describes what a partner contributes over a period. ROI measures the return on a specific investment you chose to make. You can have a profitable partner and a poor ROI on a particular campaign with them, and vice versa.
Should ROI include channel manager salaries?
Include the proportion of their time genuinely attributable to that partner if the partner could not be served without it, and if the cost would fall if the relationship ended. Exclude general management overhead that exists regardless.
How long before we can measure ROI on a new partner?
Long enough for the investment to have an effect and for deals to close — typically two to three quarters for enablement-led investment. Measuring sooner rewards short-lag activity and punishes onboarding, which is exactly backwards.
See partner contribution and margin together
Our MVP is ready. We can walk through how partner contribution, margin and recommended action combine into an investment decision.
How this guide was written
This is a practitioner guide, not a research paper. It is written from direct experience of running and advising channel partner programmes, and is intended as a structure for your own analysis rather than as evidence about your business.
- No external statistics. There are no survey results, benchmark figures or market-size claims in this article. Any number you see is either a worked illustration using clearly hypothetical figures, or a threshold we set ourselves and label as such.
- Heuristics are labelled. Where a score, weight or cut-off appears it is a founder-developed starting point, not a validated model. Calibrate it against your own data before relying on it.
- No customer results are claimed. Screenshots show illustrative data with fictional organisations. No named customer, deal or outcome is presented, and no performance improvement is implied.
- Borrowed frameworks are named. Where a guide uses an established method — for example the MEDDPICC qualification structure, or the standard management-accounting definitions of gross profit and contribution margin — it is named so you can consult the primary source rather than take our summary of it.
Related guides
Partner Profitability
How to Calculate Partner Profitability
The cost list and the formula, explained.
Partner Profitability
Which Channel Partners Should You Invest In?
A decision matrix using revenue, growth and profit.
Partner Profitability
Reducing the Cost of Managing Channel Partners
Where partner cost accumulates, and what to cut.
Related reading
Product page
Compare what each partner returns against what it costs to serve.
Channel partner profitability software →