
Reseller Performance
What KPIs Should You Track for Channel Partners?
A partner scorecard has one job: to tell you which partners deserve more of your attention, and which are consuming it without returning it. Most scorecards fail that job by measuring too much and deciding too little.
Track a small set of channel partner KPIs that spans four things: what the partner sells, how efficiently they sell it, whether they are building future pipeline, and how much profit they leave you. The eight below are grouped that way: Revenue and Contribution margin (what they sell and what you keep), Win rate and Sales-cycle length (how efficiently they sell it), Pipeline coverage, Forecast accuracy and Registration rate (whether you can see the pipeline in time to help), and Enablement adoption (whether the investment is landing). Review six to eight at portfolio level, and use two or three in any single partner conversation. Partner satisfaction is deliberately not in the set: it is a sentiment measure that rarely changes a decision, which is the only test that matters here. Everything beyond that is reporting, not management.
The temptation with channel measurement is to add. Partners generate a lot of data and it is easy to build a dashboard with forty columns. The result is a review meeting where everyone reads numbers aloud and nothing is decided.
The test for any metric is simple: if it moved, what would you do differently? If the answer is nothing, it does not belong on the scorecard.
The core partner KPI set
| KPI | How to calculate it | The decision it informs |
|---|---|---|
| Revenue | Partner-attributable closed revenue in the period | Scale and territory coverage |
| Contribution margin | Partner-attributable gross profit less partner-specific costs ÷ revenue | Whether the partner is profitable, not just large |
| Win rate | Deals won ÷ deals closed (won + lost) | Quality of qualification and enablement |
| Pipeline coverage | Open qualified pipeline ÷ remaining target | Whether the target is reachable this period |
| Sales-cycle length | Median days from qualified to closed won | Whether deals are progressing or ageing |
| Forecast accuracy | 1 − (|forecast − actual| ÷ actual) | How much to trust what the partner tells you |
| Enablement adoption | Active users of training/collateral ÷ licensed users | Whether investment in enablement is landing |
| Registration rate | Registered deals ÷ total partner deals | Whether you can see demand in time to help |
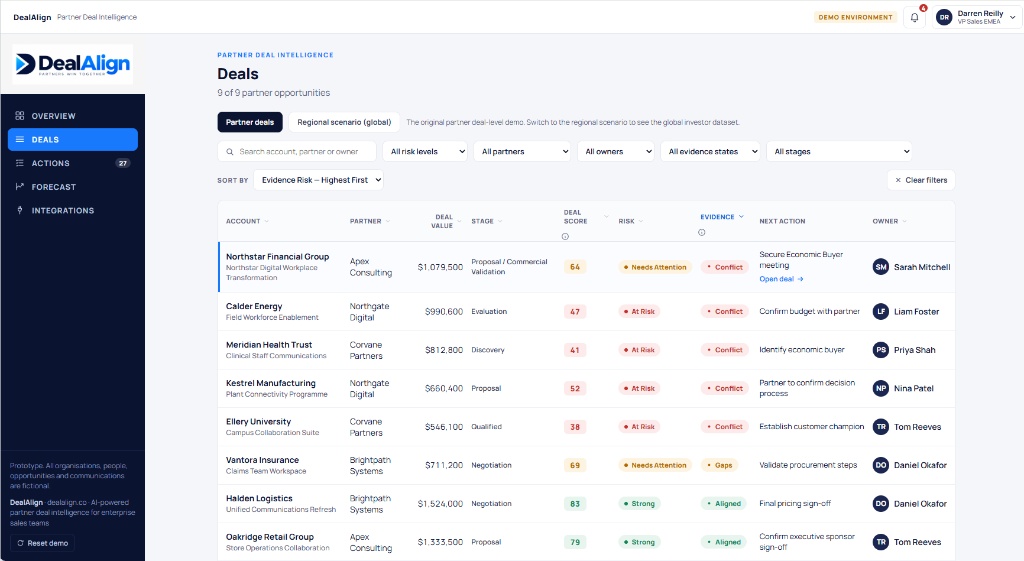
Real DealAlign screen: deal-level measures underneath the aggregate KPIs — which is what lets a win-rate or coverage number be explained rather than merely reported. Illustrative data — fictional organisations and figures.
Separate leading from lagging measures
Revenue, win rate and margin are lagging: by the time they move, the quarter is decided. A partner scorecard that contains only lagging measures tells you how you did, never what to do next.
Pair each lagging measure with one leading indicator:
- Revenue → pipeline coverage and the age of last buyer-confirmed contact.
- Win rate → qualification completeness at stage entry.
- Margin → discount depth trend and the mix of services attached.
- Forecast accuracy → the proportion of forecast value backed by buyer evidence.
Two calculations worth getting right
Pipeline coverage =
open qualified pipeline value
÷ remaining period target
Denominator: remaining period target = the committed revenue target for the rest of the period, not the full-period target. Zero denominator: if the remaining target is zero or already met, coverage is undefined — report "target met, coverage not applicable" rather than dividing by zero or showing an infinite ratio. Extreme values: a coverage ratio far above your normal range usually means the target is too small to be meaningful, not that you have exceptional pipeline. Coverage is only meaningful if "qualified" means something too — if every registered deal counts, the number flatters. Require a buyer-confirmed next step before a deal counts toward coverage. Use the same evidence standard described in channel sales forecasting.
Forecast accuracy =
1 − ( |forecast − actual| ÷ actual )
Denominator: actual is the revenue the partner actually closed in that period. Express the result as a percentage, not a fraction.
Worked cases (forecast → actual): 100 → 100 = 100% (|0| ÷ 100 = 0). 100 → 200 = 50% (|−100| ÷ 200 = 0.5). Underforecasting by half costs half the accuracy, not all of it. 200 → 100 = 0% (|100| ÷ 100 = 1). 400 → 100 = −200%, clamped to 0%. The formula is asymmetric because it scales the error by the actual: missing low costs more accuracy than missing high. That is deliberate — it is the convention this article uses — but state it, because a symmetric variant divides by the forecast instead.
Zero denominator. Forecast 0 with actual 0: undefined — record "no activity" and exclude from averages rather than scoring it 100%. Forecast positive with actual 0: division by zero, undefined — record "nothing closed" and flag it as the most severe miss, never render it as 0% or −100%. Forecast 0 with actual positive: defined by the formula and equal to 0% (|0 − actual| ÷ actual = 1), which correctly marks a forecast that missed entirely.
Zero floor. Accuracy cannot meaningfully go below 0%, so clamp negatives at zero and note the size of the miss separately — a clamp hides how badly a forecast missed if you rank partners on accuracy alone.
Calculate it per partner, per quarter, and look for the pattern. A partner who is consistently 30% optimistic is not lying — they have a different definition of commitment. Knowing which partners to discount, and by how much, is more useful than a single blended accuracy figure.
Metrics that look useful but mislead
- Number of partner sign-ups. Signed agreements are not revenue. A large and growing partner list with flat revenue is a support cost, not a channel.
- Total pipeline value. Unweighted and unqualified pipeline grows whenever anyone is optimistic. It rewards the wrong behaviour.
- Activity counts. Calls, meetings and emails measure effort, not progress or outcome.
- Partner satisfaction score alone. Satisfaction without revenue and margin tells you the relationship is pleasant, not productive. Track it, but never as the primary measure.
- Revenue without cost. A revenue-only scorecard cannot distinguish a growth partner from one who is expensive to serve. See why high-revenue partners can be unprofitable.
Review cadence and thresholds
A KPI without a threshold is trivia. Decide in advance what would trigger a conversation, and what that conversation is for.
| Measure type | Cadence | Example trigger | Response |
|---|---|---|---|
| Deal-level signals (contact age, next action) | Weekly | No buyer contact in 21 days | Triage call with the partner owner |
| Pipeline coverage | Fortnightly | Below the coverage ratio you need for your cycle | Demand-generation or qualification review |
| Win rate, cycle length | Monthly | Two consecutive months of decline | Enablement and qualification audit |
| Contribution margin | Quarterly | Falls below the portfolio floor | Commercial review, pricing or cost review |
| Forecast accuracy | Quarterly | Persistent bias in one direction | Reset the evidence standard with that partner |
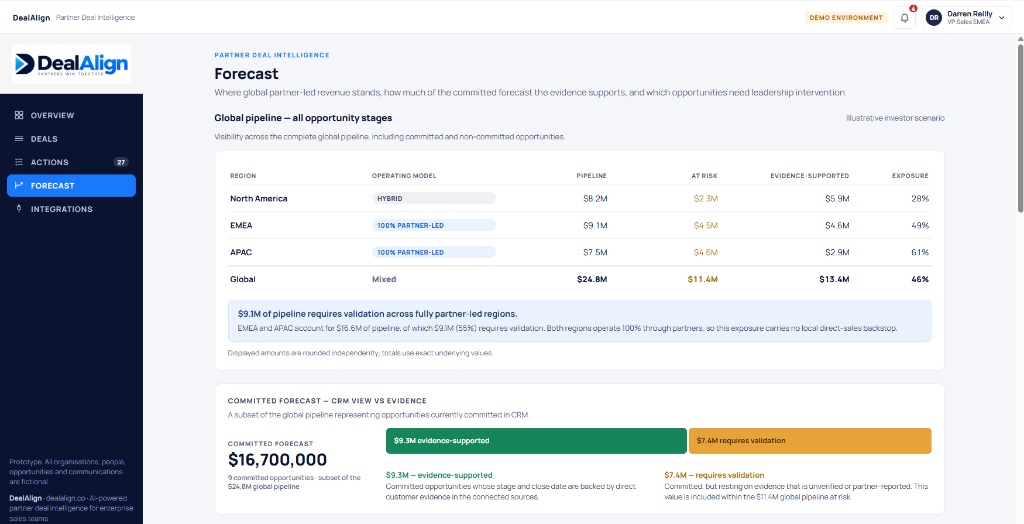
Real DealAlign screen: committed and evidenced pipeline shown separately, which is what makes forecast accuracy a per-partner measure rather than a blended average. Illustrative data — fictional organisations and figures.
Building the scorecard without a project
- Start with the decision. List the three decisions you need to make about partners this quarter — invest, improve, or reallocate. Choose measures that inform those, and only those.
- Fix definitions in writing. One page, agreed with the partner, stating exactly what counts as a qualified deal, a won deal and a contribution margin.
- Establish a baseline before you set a target. You cannot set a sensible win-rate target without knowing the current one.
- Report by partner, not just in total. Aggregates hide the allocation problem the scorecard exists to solve.
- Review, then change one thing. Every review should end with a specific change, owner and date — or it is a briefing, not a review.
Key takeaways
- Six to eight KPIs is the ceiling; two or three per partner conversation is the working number.
- Every metric must pass one test: if it moved, what would you do differently?
- Pair every lagging measure with a leading one or the scorecard cannot guide action.
- Contribution margin belongs in the set, otherwise you cannot rank partners by value.
- Set thresholds in advance so the review produces decisions instead of discussion.
Frequently asked questions
How many KPIs should we track per channel partner?
Six to eight at portfolio level, and no more than three or four used in any single partner conversation. Beyond that, nobody can act on the numbers and the review becomes a reporting exercise rather than a management one.
Should partner KPIs include profitability or only revenue?
Profitability has to be in the set, otherwise you cannot distinguish a partner who is growing your business from one who is growing your revenue at your expense. Revenue alone cannot answer which partners deserve more investment.
What is the difference between leading and lagging partner KPIs?
Lagging KPIs report what happened — revenue, win rate, margin. Leading KPIs indicate what is about to happen — pipeline coverage, registration rate, age of last buyer contact. A scorecard needs both, because lagging measures are too late to act on alone.
How do we get partners to agree to be measured on these?
Show them what is in it for them. Measures that make joint deals easier — registration protection, faster presales, deal-level reviews — are usually welcomed. Measures that only police them are not. Introduce the scorecard alongside something the partner gains.
What if we do not have the data for these KPIs yet?
Start with what you can get and add deliberately. Revenue, win rate and cycle length are usually available from your own systems. Contribution margin needs cost attribution work; see calculating partner profitability. Data you cannot obtain is worth flagging as a gap rather than estimating silently.
Put the scorecard somewhere people will use it
Our MVP is ready. We can show you how partner-level performance, evidence state and next actions sit together using your own partner scenarios.
How this guide was written
This is a practitioner guide, not a research paper. It is written from direct experience of running and advising channel partner programmes, and is intended as a structure for your own analysis rather than as evidence about your business.
- No external statistics. There are no survey results, benchmark figures or market-size claims in this article. Any number you see is either a worked illustration using clearly hypothetical figures, or a threshold we set ourselves and label as such.
- Heuristics are labelled. Where a score, weight or cut-off appears it is a founder-developed starting point, not a validated model. Calibrate it against your own data before relying on it.
- No customer results are claimed. Screenshots show illustrative data with fictional organisations. No named customer, deal or outcome is presented, and no performance improvement is implied.
- Borrowed frameworks are named. Where a guide uses an established method — for example the MEDDPICC qualification structure, or the standard management-accounting definitions of gross profit and contribution margin — it is named so you can consult the primary source rather than take our summary of it.
Related guides
Reseller Performance
How to Improve Reseller Performance
Segment, measure and act on reseller behaviour.
Partner Profitability
How to Calculate Partner Profitability
From revenue to net contribution, with a worked example.
Sales Forecasting
How to Improve Channel Sales Forecasting
Forecasts that survive contact with the quarter end.
Related reading
Product page
Moving from activity counts to the measures that drive commercial decisions.
Channel partner profitability software →