
Partner Sales
How to Identify Partner Sales Deals at Risk
Partner deals rarely die suddenly. They decay — a quiet champion, a postponed validation, a next step that quietly changes owner — and the decay is visible weeks before the miss if you know what to look at.
A partner deal is at risk when the evidence behind it has stopped growing. The four most reliable signs are: no direct contact with the buyer for three weeks or more; a next step with no named owner; a close date that has moved more than once; and a stage that advanced without any new buyer-confirmed information. Rather than counting signs by hand, apply the weighted risk score further down this page — it is the single rule this article uses, and it produces the same thresholds every time. The score is continuous, so the bands are stated in continuous terms: below 4 is progressing, 4 to below 7 means intervene this week, and 7 or above means remove the deal from committed forecast until it produces new buyer evidence.
The reason partner deals decay quietly is structural. In a direct deal, one team sees everything. In a partner deal, your view of the customer arrives filtered through a third party who has their own priorities, their own forecast and no particular incentive to tell you that things have stalled.
Why partner-led opportunities slip
- The champion is not yours. Your relationship is with the partner's account manager, not the buyer's decision-maker. When that account manager's attention moves, so does the deal.
- Nobody owns the gap. Technical validation, security review, procurement — each sits between two companies, and between two companies is where things wait.
- Confidence is confused with evidence. A partner saying "they loved the demo" is a report of a feeling, not a committed next step.
- Reporting lag. Partners often update you at their monthly review, so you hear about a problem up to four weeks after it happened.
The warning signs worth tracking
| Signal | Interpretation | Severity |
|---|---|---|
| No buyer contact in 21+ days | Champion disengaged or has lost internal sponsorship | High |
| Next step unowned or undated | Nothing is being actively worked | High |
| Close date moved twice | The real decision driver has not been found | High |
| Stage change with no new evidence | Pipeline hygiene disguised as progress | Medium |
| Discount requested before business case | Value not established; price is being used to compensate | Medium |
| Single-threaded partner contact | One person's attention is the whole deal | Medium |
| Support tickets rising pre-sale | Implementation risk not yet priced or planned | Medium |
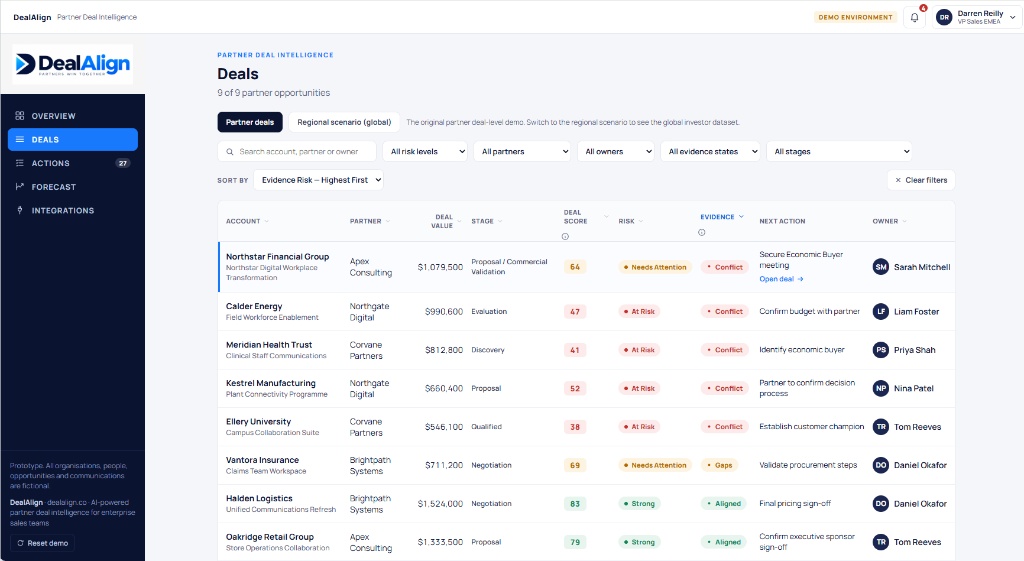
Real DealAlign screen: risk and evidence state are shown per opportunity, so deals that have stopped accumulating evidence are visible across the portfolio rather than discovered at quarter end. Illustrative data — fictional organisations and figures.
How to detect risk earlier
Earlier detection comes from measuring movement rather than status. Status is what someone asserts; movement is what changed.
- Track the date of the last buyer-confirmed event, not the last activity. An internal meeting is not buyer contact.
- Track stage duration, not stage position. A deal that has sat in "evaluation" for 40 days tells you more than one that reached "proposal" last week.
- Track ownership changes. A next action that has changed owner twice is a deal with no real owner.
- Track close-date churn. The number of times a close date has moved is a stronger predictor of loss than the date itself.
None of this requires prediction. It requires recording four fields honestly and reviewing them weekly — the discipline behind better channel forecasting.
A simple risk score you can apply today
Risk score =
(days since buyer-confirmed contact ÷ 7)
+ (2 × close-date moves)
+ (2 if next action unowned)
+ (1 if single-threaded)
Thresholds (continuous, with no gaps): below 4 is progressing — no action beyond normal review. 4 to below 7 means intervene this week. 7 or above means remove from committed forecast until the deal produces new buyer evidence. Because the score can take any value — 5.4 and 6.5 both occur in the worked examples below — each band is written as a range from one boundary up to the next, so every possible score lands in exactly one band.
These weights are a heuristic, not a validated model. They are a founder-developed starting point, not the output of a statistical study, and they have not been tested against your deal history. The components and the 7-day divisor are judgement calls chosen so that roughly three weeks of buyer silence starts to register on its own. Adjust them to your sales cycle, publish whatever you choose, and keep them stable once set — a threshold that moves every quarter measures nothing.
Worked scores: a deal with buyer contact 10 days ago, two close-date moves, an owned next action and two contacts scores (10÷7) + 4 + 0 + 0 = 5.4 — intervene. A deal contacted 35 days ago with three close-date moves, no owner and single-threaded scores (35÷7) + 6 + 2 + 1 = 14 — out of the committed forecast. A healthy deal contacted 2 days ago with no moves, an owner and multiple contacts scores 0.3 — progressing.
How internal teams and partners should respond
Detection is worthless without a defined response. Assign the response by cause, not by deal size.
| Cause | Who acts | The action |
|---|---|---|
| Buyer gone quiet | Partner, with your support | Secure a specific dated buyer meeting; if refused twice, downgrade |
| Unowned next step | Your team | Assign one named owner today, with a date |
| Repeated close-date moves | Your team + partner | Map the buyer's approval path explicitly |
| Single-threaded | Partner | Identify and meet a second stakeholder |
| Discount pressure | Your team | Return to business case before pricing moves |
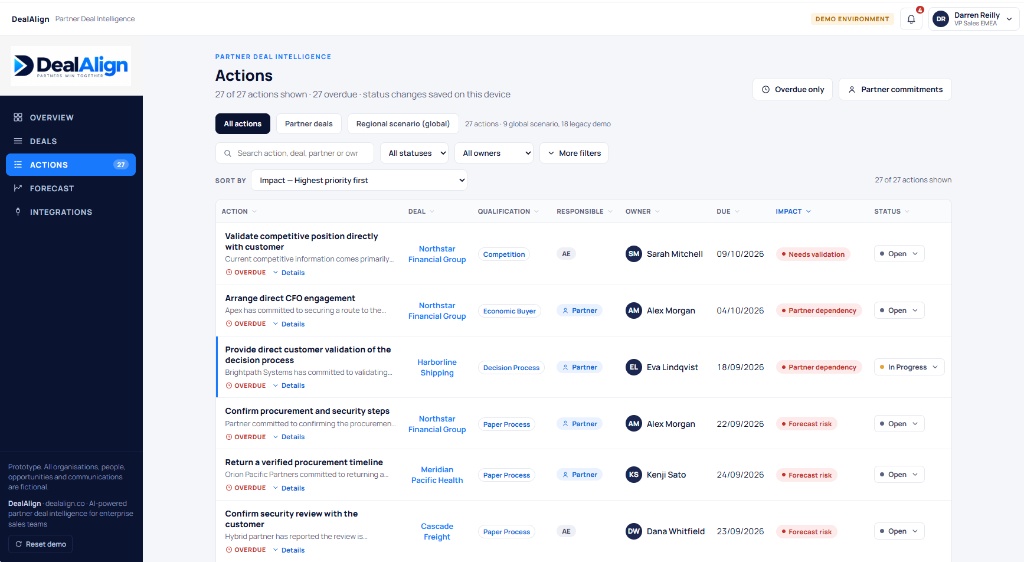
Real DealAlign screen: the response becomes a dated action with a named owner in whichever company is responsible — which is what turns a risk flag into a recovery. Illustrative data — fictional organisations and figures.
What AI can realistically contribute
Language models are good at reading long, messy deal histories and summarising what actually happened: when the buyer last appeared, what they committed to, whether the reported stage matches the evidence. That is genuinely useful at portfolio scale, where no human reads every deal every week.
What AI cannot do is confirm a buyer's intent. It can flag that the evidence is thin; it cannot manufacture the evidence. Treat its output as a triage aid, never as a substitute for a conversation with the customer.
Key takeaways
- Partner deals decay visibly — the signals precede the loss by weeks.
- Measure movement, not status: buyer contact recency, stage duration, owner changes, close-date churn.
- Act on the weighted score, not a signal count. Below 4 is progressing; 4 to below 7 means intervene this week; 7 or above means remove the deal from committed forecast until new buyer evidence appears.
- Response must be assigned by cause, not by deal size.
- AI helps you triage evidence; it cannot replace buyer confirmation.
Frequently asked questions
What is the single strongest warning sign?
Length of time since the buyer — not the partner — last confirmed something. A deal where the last three interactions were internal or partner-only has stopped progressing commercially, whatever the stage field says.
Should we remove at-risk deals from the forecast?
Not all of them, but reclassify them. Keep them in pipeline, move them out of committed revenue until they produce new buyer evidence. That single separation stops a forecast from being a measure of optimism.
How often should partner deals be reviewed?
Weekly for material deals, because the decay cycle is roughly three weeks. A monthly review means you learn about a problem after the intervention window has often closed.
Is this different for distributors?
Yes — with a distributor you often cannot see the end-customer deal at all, only sell-in. The signals shift to distributor stock, resale velocity and end-customer registrations. See improving distributor sales performance.
See every partner deal's risk in one view
Our MVP is ready. We can show you how risk, evidence state and next action appear across a partner portfolio, using your own scenarios.
How this guide was written
This is a practitioner guide, not a research paper. It is written from direct experience of running and advising channel partner programmes, and is intended as a structure for your own analysis rather than as evidence about your business.
- No external statistics. There are no survey results, benchmark figures or market-size claims in this article. Any number you see is either a worked illustration using clearly hypothetical figures, or a threshold we set ourselves and label as such.
- Heuristics are labelled. Where a score, weight or cut-off appears it is a founder-developed starting point, not a validated model. Calibrate it against your own data before relying on it.
- No customer results are claimed. Screenshots show illustrative data with fictional organisations. No named customer, deal or outcome is presented, and no performance improvement is implied.
- Borrowed frameworks are named. Where a guide uses an established method — for example the MEDDPICC qualification structure, or the standard management-accounting definitions of gross profit and contribution margin — it is named so you can consult the primary source rather than take our summary of it.
Related guides
Partner Sales
How to Increase Sales Through Channel Partners
Where partner revenue leaks, and how to fix it.
Partner Sales
Collaboration Between Sales Teams and Partners
Fixing ownership when a deal spans two companies.
Sales Forecasting
How to Improve Channel Sales Forecasting
Forecasting against evidence rather than confidence.
Related reading
Product page
How evidence gaps are shown per partner deal, before the forecast is committed.
Partner deal risk management →