
Reseller Performance
How to Improve Distributor Sales Performance
A distributor can hit every sell-in target you set and still be a problem. Sell-in measures your shipment; sell-through measures your business. Improving distributor performance starts with knowing which one you are looking at.
Improve distributor sales performance by managing sell-through rather than sell-in. That means tracking end-customer demand, distributor stock cover and resale velocity alongside shipments; agreeing targets in sell-out terms not just purchase orders; giving the distributor's salespeople something specific to sell with; and reviewing performance weekly at deal level rather than quarterly at revenue level. Where you cannot see the end customer, invest in the few signals that approximate it — registrations, activation and stock turn.
Distribution adds a layer between you and the customer. That layer is useful — reach, logistics, credit, local relationships — but it also means your reporting measures your own shipment, not your customer's purchase. Everything that follows depends on being clear about that difference.
Why sell-in misleads
- It is your revenue, not their demand. A distributor filling a warehouse is a purchase order, not a sale.
- It rewards the wrong behaviour. Quarter-end push incentives encourage stock loading, which suppresses the next quarter.
- It hides the end customer entirely. If the distributor cannot sell it on, you find out one or two quarters later, when the reorder does not arrive.
- It flatters everyone. Both teams can report success while the actual installed base is not growing.
The measures that actually reflect distributor performance
| Measure | Calculation | What it reveals |
|---|---|---|
| Sell-through | Units or value resold to resellers/end customers in the period | Real demand for your product |
| Stock cover | Closing stock ÷ average weekly sell-through (same unit and basis) | How many weeks of inventory are parked in the channel |
| Sell-through ratio | Sell-through ÷ sell-in | Whether shipments are being absorbed or accumulated |
| Active resellers | Resellers who transacted at least once in 90 days | Whether reach is real, or a list of dormant accounts |
| Attachment rate | Units with an attached service/subscription ÷ total units | Quality of the sale, not just the volume |
| Registration rate | End-customer deals registered ÷ deals shipped | Whether you can see demand at all |
| Return/credit rate | Returns and credits ÷ shipped value | Whether the sell-through was genuine |
Reading stock cover
Stock cover (weeks) =
distributor closing stock value
÷ average weekly sell-through value
Units. Both figures must be in the same unit, the same currency and the same time basis — either both at cost or both at resale value, and both including or both excluding tax. Dividing unit counts by a value-based sell-through produces a number with no meaning, and mixing cost with sell price overstates cover by the distributor's margin. State the basis next to the figure so two people comparing programmes get the same answer.
When sell-through is zero. If average weekly sell-through is zero, cover is undefined — not infinite and not zero. Report it as "no sell-through" and treat it as the most serious signal in the set, because a distributor holding stock it is not moving at all has an infinite payback period. Do not let a spreadsheet render a divide-by-zero as a blank cell, which reads as "fine".
Compare cover against the distributor's own lead time plus a buffer. A distributor holding far more cover than its replenishment cycle needs is either over-ordered, or not selling. The direction of travel matters more than the absolute number — rising cover with flat sell-through is the earliest reliable warning you will get.
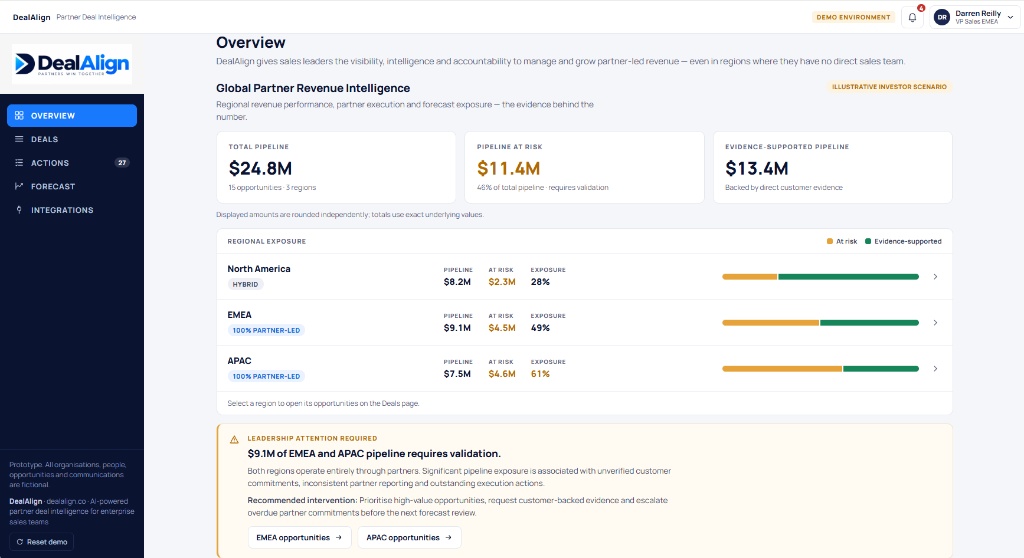
Real DealAlign screen: regional and partner-level performance in one view, so a territory that is shipping but not converting is visible next to the ones that are working. Illustrative data — fictional organisations and figures.
Four levers that move distributor performance
1. Make the target a sell-out target
Set the primary number in sell-through terms and let sell-in follow. If you must incentivise shipments, tie the incentive to sell-through and to stock cover limits, so a distributor cannot earn the rebate by loading stock it cannot move.
2. Sell to the distributor's salespeople, not just their management
A distribution agreement is signed with a management team. The revenue comes from individual salespeople who have a portfolio of dozens of vendors and limited attention. Give them a specific reason to lead with your product: a clear competitive position, deal registration protection, responsive presales, and a named person on your side who answers within a day.
3. See the deals, not just the totals
Totals hide everything. Where distributors will share it, deal-level visibility — even a minimum set of stage, value, close date and next action — turns a quarterly argument into a weekly fix. This is the same discipline described in identifying partner deals at risk, applied one tier further from the customer.
4. Fix the enablement gap that actually blocks deals
Most distributor enablement investment goes into training content. Most distributor deals are blocked by presales capacity, technical validation and quoting. Ask what stopped the last ten deals and fund that, rather than another certification module.
When you genuinely cannot see the end customer
In many two-tier models the end-customer deal is not visible to you at all, and it will not become visible by asking more insistently. In that situation, manage the proxies deliberately:
- Registrations. Offer something worth registering for, and measure the registration rate as a leading indicator.
- Activation and usage. Where the product reports usage, active installations are a far better demand signal than shipments.
- Reseller breadth. A growing number of active resellers behind a distributor is a healthy sign; a flat count with rising shipments is not.
- Service attach. Attach rates reveal whether the product is being deployed rather than warehoused.
A 90-day improvement plan
- Days 1–15: establish the baseline — sell-in, sell-through, stock cover, active resellers and returns for the last four quarters, by distributor.
- Days 16–30: agree a minimum data-sharing set with each material distributor, in writing, and confirm how often it will arrive.
- Days 31–60: restate targets in sell-out terms and align incentives so stock loading is not rewarded.
- Days 61–75: run a joint deal review on the top twenty open opportunities and assign one owner and one date per deal.
- Days 76–90: review what changed, and reallocate attention toward distributors whose cover is falling and whose active reseller count is rising.
Key takeaways
- Sell-in is your shipment; sell-through is your business. Manage the second.
- Stock cover rising while sell-through is flat is the earliest reliable warning sign.
- Set targets in sell-out terms and tie incentives to sell-through so loading is not rewarded.
- Deal-level visibility beats quarterly totals where distributors will share it.
- Where the end customer is invisible, manage registrations, activation, reseller breadth and service attach as proxies.
Frequently asked questions
What is a good sell-through ratio?
There is no universal figure — it depends on lead times, product lifecycles and whether the distributor holds stock at all. What matters is the trend against that distributor's own history and their replenishment cycle. A ratio that drifts down over successive quarters while sell-in holds steady is the signal.
Our distributor will not share sell-through data. What then?
Make it a condition of the relationship over time, phased in at renewal, and offer something in return — co-funded demand generation, better presales support or preferential allocation. In the meantime, manage registrations, activation and reseller breadth, and treat any distributor who refuses all of them as a concentration risk.
Should we go direct around a poorly performing distributor?
Rarely as a first move — it damages the channel's trust in you and is hard to reverse. First establish whether the problem is demand, enablement or the distributor's own prioritisation. If it is the third across several quarters, a structured conversation about territory or a second distributor is usually more effective than going direct.
How many distributors should we have?
Enough to cover the territory properly, few enough that each has a reason to invest. Adding distributors spreads your support thin and rarely increases total sell-through in a mature territory. See deciding which partners to invest in.
See distributor performance at deal level
Our MVP is ready. We can show you how partner and territory performance, pipeline coverage and evidence state appear side by side using your own scenarios.
How this guide was written
This is a practitioner guide, not a research paper. It is written from direct experience of running and advising channel partner programmes, and is intended as a structure for your own analysis rather than as evidence about your business.
- No external statistics. There are no survey results, benchmark figures or market-size claims in this article. Any number you see is either a worked illustration using clearly hypothetical figures, or a threshold we set ourselves and label as such.
- Heuristics are labelled. Where a score, weight or cut-off appears it is a founder-developed starting point, not a validated model. Calibrate it against your own data before relying on it.
- No customer results are claimed. Screenshots show illustrative data with fictional organisations. No named customer, deal or outcome is presented, and no performance improvement is implied.
- Borrowed frameworks are named. Where a guide uses an established method — for example the MEDDPICC qualification structure, or the standard management-accounting definitions of gross profit and contribution margin — it is named so you can consult the primary source rather than take our summary of it.
Related guides
Reseller Performance
How to Improve Reseller Performance
Segment, measure and act on reseller behaviour.
Reseller Performance
What KPIs Should You Track for Channel Partners?
The small set of measures that actually change behaviour.
Partner Sales
Identifying Partner Sales Deals at Risk
Warning signs that appear weeks before a loss.
Related reading
Product page
See what a distributor returns once commissions, rebates and support are attributed.
Channel partner profitability software →